Research Article - (2025) Volume 13, Issue 1
Coastal erosion hazard assessment mapping along the coast of Kanyakumari district, South West India, using C++ language
Conchalish Henry1*, Sakthivel Saravanan2 and Nainarpandian Chandrasekar22Department of Environmental Science and Engineering, Manonmanium Sundaranar University, Tamil Nadu, India
Received: 22-Sep-2023, Manuscript No. JSG-24-114571; Editor assigned: 25-Sep-2023, Pre QC No. JSG-24-114571 (PQ); Reviewed: 09-Oct-2023, QC No. JSG-24-114571; Revised: 03-Jan-2025, Manuscript No. JSG-24-114571 (R); Published: 10-Jan-2025, DOI: 10.51268/2736-187X.25.13.086
Abstract
Coastal erosion is a natural phenomenon an endless redistribution process that continually changes beaches, dunes, and bluffs. Loss or displacement of land along the coastline occurs naturally and will continue to do so despite the best efforts to prevent it. This paper mainly focuses on the coastal erosion hazard assessment estimated along the coastal precinct between Kanyakumari and Thengapattanam, South-West Tamil Nadu, over a length of about 56 km and discusses mitigation. The assessment of beach erosion hazards is an estimation of a coastal area’s susceptibility to erosion based on a number of factors, such as historical coastal changes, geomorphology, current patterns, and human activities. In this study, only mean annual beach width change rate information is used for assessment. The coastal erosion hazard maps are prepared using GIS techniques to depict the extent of erosion at each profile in Kanyakumari district, south-west India. The five relative erosion hazard categories defined are: very high, high, moderate or medium, low, and very low. The very high category would identify beaches with the highest erosion rates. Results reveal that 37% of the study area is under threat of coastal erosion in the very high-risk category. The beach erosion hazard maps are useful for technical (e.g., planners, engineers) and non-technical (e.g., landowners, general public) users, and mitigation methods are also discussed. A C++ programme is developed to estimate the erosion hazard category of the location as the range of the erosion is known.
Keywords
Coastal erosion, C++, Erosion hazard assessment, Kanyakumari, GIS
Introduction
Beach erosion is a universal problem, and it has been estimated that 70% of all the beaches in the world are eroding (Basco, 1999). Coastal erosion is a natural phenomenon an endless redistribution process that continually changes beaches, dunes, and bluffs. Coastal erosion is defined as the long term loss of shore material (by volume) relative to a fixed reference line (baseline) and an initial reference volume to the seaward of this line above some arbitrary vertical datum (Batten et al., 2002). Waves, currents, tides, wind-driven water, ice, rainwater runoff, and groundwater seepage all move sand and make changes along the coast. Human activities such as construction, mining, boating, and recreation can accelerate the erosion of sandy beaches, dunes, and bluffs. Although beaches, dunes, bluffs, nearshore areas, and vegetation are subject to the forces of erosion, they also protect shore land and inland areas from wind and water erosion and storm-induced high water (Bird, 1985). Beaches, dunes, and bluffs protect shorelines from erosion by absorbing the wave energy of open water. They are also reservoirs of sand and gravel for beaches and offshore sandbar and shoal formations (Black et al., 2008). When this natural process destroys houses, buildings, and roads, interferes with public power supplies, and paralyses communities, it becomes a major threat to human life and property (Brown et al., 2004). Coastal erosion in the study area is caused by a number of factors, such as high monsoon wind waves and currents, high monsoon river discharge, mining, and storm surges. Superimposed on these will be the sea level rise, which can cause considerable erosion directly and through modification of these factors (Chandrasekar et al., 2010). Beach erosion occurs when sediment is removed from beaches at a rate that exceeds its replacement and is influenced by both natural processes and human factors (Chunting, 1996). Surveys of beaches around the world show that sand loss from beaches and the consequent landward movement of coastlines are very widespread. The coastal erosion hazard maps can be used as a tool to sensitise the general public about coastal erosion and associated impacts and identify coastal areas that have shown historical patterns of erosion and are likely to display similar patterns in the future (Clayton, 1995).
Also, it prioritises the allocation of resources for erosion defence, increased monitoring, and/or further research on coastal dynamics. The hazard maps display the spatial relationship of coastal hazard areas with existing coastal developments and infrastructure (Cooper et al., 2005). During episodic erosion events, it is important to be able to identify developments located near coastal areas that are susceptible to erosion.
Additional investigation of seasonal erosion and accretion patterns can also guide the development of the study area and assist with the development of strategies for addressing the problems that may arise because of coastal erosion. This is helpful to perform a preliminary selection of coastal areas for sand mining, tourism, housing development, coastal structures (e.g., docks), and infrastructure development (Cooper et al., 2000).
The coastal erosion and accretion problem on Las Canteras Beach, Spain, was studied by monthly beach profiles. Cooper and Guillen have reviewed that beach profiles are an important tool for elucidating long-term trends, such as erosion and accretion, and for predicting the future evolution of coastal landforms. El-raey et al., used remote sensing for detecting beach erosion and accretion along Damietta Port, Egypt. Sunamura developed a simple numerical model of beach morphological change caused by short-term events and described both erosion and accretion phases of a beach in the field (El-raey et al., 1999). A sediment budget approach was used to study the erosion problems being experienced on the popular tourist beach in Queen's Bay, Jercy Channel Islands. Using GIS technology to visualise coastal erosion predictions provides a powerful means to understand coastal changes and their impact at local and regional scales. Several case studies have developed methods for hazard mapping (Guillen et al., 1999).
Chunting Xue made observations on the field investigation of Amatuku, a small island on the northeast rim of Funafuti Atoll, Tuvalu shoreline, reef flat, a borrow pit, and a channel to determine the extent of erosion and the causes. Edsel B. Daniel studied the beach erosion hazard for St. Kitts and Nevis, which was completed as part of the Organisation of American States/U.S. Agency for International Development (OAS/USAID) Post Georges Disaster Mitigation (PGDM) project (Hentry et al., 2013). This is the base study to make use of Geographic Information System (GIS) technology, and mean annual beach change rate information was used to prepare these maps. An analytical treatment was presented showing that there is a highly multiplicative association between long-term sandy beach erosion and sea level rise (Keqi Zhang et al., 2004).
Sergio R. Dill Enburg et al., made a critical evaluation of published data addressing coastal erosion in Rio Grande do Sul and strongly suggested that a short- or long-term negative balance on the budget was the main cause of erosion along the coastline. The coastal evolution of Kerala, with special reference to coastal instability and erosion, has been reviewed.
The long-term erosional/accretional trend along Kerala's coast using satellite imagery and aerial photographs was studied for the year 1990 and the survey of India topographic maps of 1967. The erosion during the monsoon and subsequent build up of the beach during the post-monsoon period have already been studied for some locations of the Kerala coast Severe beach erosion was reported along the Kerala coast during the southwest monsoon season (Krause et al., 2004). The important mechanism for high erosion during the south-west monsoon is the cross-shore sediment transport rather than the longshore transport studied (Kurian et al., 1985).
Coastal erosion and habitat loss along the Godavari Delta front were attributed to the combination of dam construction across the Godavari and its tributaries that diminished sediment supply to the coast and continued coastal land subsidence (Malini et al., 2004). Keqi Zhang attempted to study the erosion and accretion processes through time series analysis using a GIS technique. Saxena studied the Integrated Coastal Zone Management (ICZM) Plan of the Tamil Nadu State through the identification and assessment of coastal hazards and the overall vulnerability to coastal flooding and erosion. Erosion along the beaches near river mouths has been commonly noticed along the Karnataka coast. In Kerala, about 360 km of coastline were exposed to erosion (Perumal et al., 2008). Along the Tamil Nadu coast, the erosion rate observed at Poompuhar, Tarangampadi, Nagapattinam, Mandapam, Manapadu, Ovari, Kanyakumari, Pallam, Manavalakurichi, and Kolachel was about 0.15, 0.65, 1.8, 0.11, 0.25, 1.1, 0.86, 1.74, 0.60, and 1.2 m/yr, respectively. The coast near Ovari was exposed to severe erosion in June, whereas alternate erosion and accretion trends have been noticed in Kanyakumari (Samsuddin et al., 1987). Beach erosion was noticed at the Digha, Bankiput, and Gangasagar regions of the West Bengal coast.
The main objective of this paper is to develop coastal erosion hazard maps and erosion analysis that are suitably presented using GIS techniques to depict the extent of erosion at each profile for Kanyakumari district, south-west India. The coastal erosion and accretion of the study area are analysed by using a detailed examination of the monthly beach profile survey and thereby developing GIS integrated coastal hazard maps (Shahul et al., 2007). The most suitable mitigation methods are suggested for the study area. The various risk zones are identified based on various parameters such as beach width, beach sand change rate, distance from water, and vegetation cover. Also, a C++ programme is developed with a flow chart diagram to calculate the erosion hazard category of the study area of any region.
Location of the study area
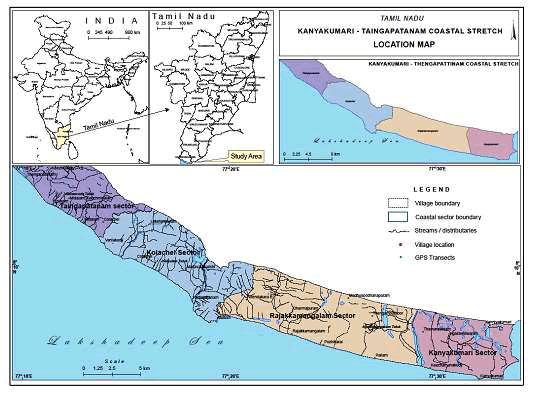
Kanyakumari district is situated in the extreme South of the Indian subcontinent. The coastal ecosystem of this District comprises 68 kilometres in length and is studded with 44 coastal fishing villages. The study area located in the coastal stretch of Kanyakumari and Thengapattanam (56 km) is lying at latitudes 8°4'53.9" N–8°1427.1 N and longitudes 77°3151.8E–77°107.3E in Agasteeswaram, Kalkulam, and Vilavancode Taluks in Kanyakumari district of Tamil Nadu state, part of erstwhile Travancore-Cochin state (Figure 1).
Figure 1. Location of the study area.
It comprises a group of associated hills and hillocks forming the Southern terminus of the Western Ghats, close to the confluence of three seas: The Indian ocean, the Arabian sea, and the Gulf of Mannar. It stretches in the south-east-northwest direction in the form of a narrow ridge, which is irregular in shape and juts out in the form of promontories in several places. Most of the topography in the district is undulating in nature, like in Kerala, which helps the water from heavy rain collect and flow to a low-lying area. The study area is highly dynamic, with many cyclic and random processes owing to a variety of resources and habitats. The coastal ecosystem is highly disturbed and threatened by problems like pollution, erosion, flooding, seawater intrusion, storm surges, tsunamis, and ever-expanding human settlements. In order to simplify the approach and analysis of this study, the study area has been subdivided into four coastal sectors, namely Thengapattanam (THEN), Colachel (COL), Rajakkamangalam (RMT), and Kanyakumari (KK), on the basis of coastal geomorphology, drainage pattern, wave energy conditions, etc. There are three important riverine ecosystems that converge with the Arabian sea within the study area. They are: Thengapattanam estuary is formed by the joining of the river Thamirabarani between Thengapattanam and Eraiyumanthurai. The Valliyar estuary is formed by the river Valliyar near Kadiapattanam.
The Pazhayar, the Southernmost River of the Indian Peninsula, originating from the Mahendragiri hills and draining into the Arabian Sea through Manakudi Estuary, is flowing some kilometres away from the hill group. The Manakudy estuary is formed by the joining of the Pazhayar river between East and West Manakudy villages. Two minor estuaries the Pambar estuary near Colachel and the Pantri estuary near Rajakkamangalam are also located in the district. The south-west monsoon prevailing in this area from June to September is comparatively weak but extends for a longer period. The north-east monsoon is comparatively stronger than the south west monsoon and brings rain from October to December. Summer storms occur in April and May, accompanied by sudden rain. The annual average rainfall in the district is 1448.6 mm, with a maximum of around 247 mm in October and a minimum of 21 mm in February. The study area's coast is predominantly human land and known for its long history of human interference. The sea bed topography near the shore is characterised by patchy, uneven topography with rocky patches in the northern, central, and southern portions, generally up to a water depth of 9–10 metres, beyond which it is even topography. The overall gradient is generally gentle to moderate. The study area is endowed with many geomorphological stretches with gentle slopes where relatively higher stretches of varied elevation are encountered. The
Kanyakumari-Thengapattanam coast under study is a typical coastal stretch with many unique characteristics. The occurrence of placer deposits along the Kadiapatanam-Midalam coast is one feature of this coast. Estuaries, creeks, and lagoons occupy most of the coasts of the study area. The Kanyakumari sector is occupied by ponds, salt pans, cliffs, Manakudy estuary regions, and the Palayar deltaic region. Mud flats, ridges, Swale systems, cusps, and sandy plains are the significant geomorphological features of the Rajakkamangalam region. The rocky shore, offshore islands, creeks, alluvial plains, and Teri sand are important in the Colachel sector. The Thengapattanam sector is engulfed by the sandy plain, Thengapattanam estuary, offshore islands, Teri sand, and tidal flats. The Southern parts of the coast are sandy beaches, with beach sands containing heavy minerals on the Eastern and Western sides of Kanyakumari. The sand dunes rise up to 67 metres. The general relief goes over 15 m above MSL. The study area is highly wave-dominated; hence, the coastal lands are exposed to frequent erosion and accretion. The rainfall along the entire coast is highly varied. Littoral Environmental Observation (LEO) studies have also shown that there is considerable variation in wave heights, which are associated with the monsoon system.
Materials and Methods
To create maps showing relative beach erosion hazards, it is necessary to create relative erosion hazard rankings for each coastal area. The assessment of beach erosion hazards is an estimation of a coastal area’s susceptibility to erosion based on a number of factors, such as historical coastal changes, geomorphology, wave and current patterns, and human activities. In this study, only mean annual beach width change rate information is used. The beach programme is committed to visualising the raw beach profile survey data obtained from emery poles and surveyors levels and also studying the standard morphological and volumetric parameters of beaches.
It supports analysis functions like cross-shore beach width, beach slope, cross-sectional area, and sediment volume. The horizontal width, slope, and cross-sectional area of all profile segments can be calculated. The sediment volume of a beach above any user-specified datum, mean beach slope, and cross-shore beach width can also be calculated. The programme evaluates the changes in slope, beach width, and sediment volume for each and every segment of the beach profile.
The net erosion, net accretion, and effective erosion or accretion made on the beach can be calculated.
Beach profile measurements
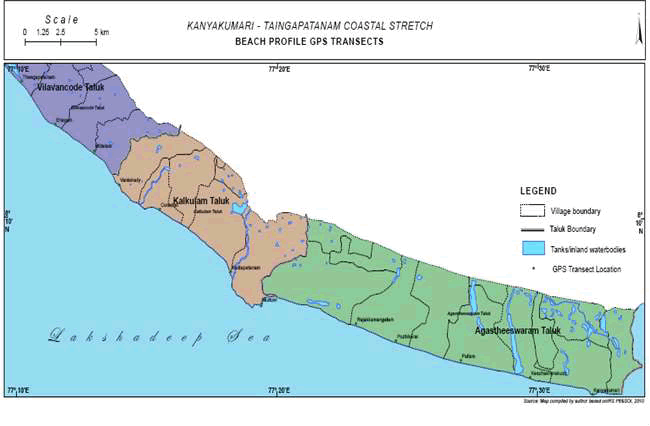
Beach profile analysis assists us in understanding and quantifying the difference in sediment levels that are undergoing continuous changes in response to environmental process variables such as wind, waves, tides, ground water, etc. Major changes in sand volume on the beach tend to be systematic and can be related to the character of wave motion, tidal cycles, and currents. On every fourth day before the full moon, at the time of the low tide, beyond the low water level, as far as wading depth, a profiling survey has been carried out. A beach profile study has shown significant changes in the beach morphodynamics, displaying erosion activities that shift the beach morphology. The beach profilewas monitored monthly for 12 locations in the study area. The profile measurements have been taken from December 2006 to December 2008, 25 months’ perpendicular to the coastline. The ‘Stack and Horizon method has been used for beach profile surveys. The locations of these profiles are shown in Figure 2. The levelling above Mean Sea Level (MSL) and below Mean Sea Level (MSL) data are adjusted to MSL datum using a fixed benchmark of known elevation, located behind the beach, during the lowest-low period, when the maximum length of the beach cross section is exposed. A reference point is established at a site, from which all measurements are taken. The end of the profile is the offshore steep, near the wave break point, where there is a marked steep.
Figure 2. Beach profile transects map of the study area.
Beach profile analysis
Several software programmes are available to perform beach profile data analysis. The majority of them are location-based and analyse the data obtained from specific beaches alone.
Only a few programmes, like Beach Profile Analysis System (BPAS), Beach Morphology Analysis Package (BMAP), Regional Morphology Analysis Package (RMAP), Shoreline and Nearshore Data System (SANDS), and Beach Profile Analysis Toolbox (BPAT), are available to perform beach profile analysis. The development of the long island South shore database, developed by the marine sciences research centre, New York department of state, to analyse and interpret the extensive profile data, was described. The present programmer, The Beach, is easy-to-use, and it performs the input and analysis of the raw beach profile survey datasets obtained from Emery poles or surveyors levels (Chandrasekar and Shiek Mujabar, 2011).
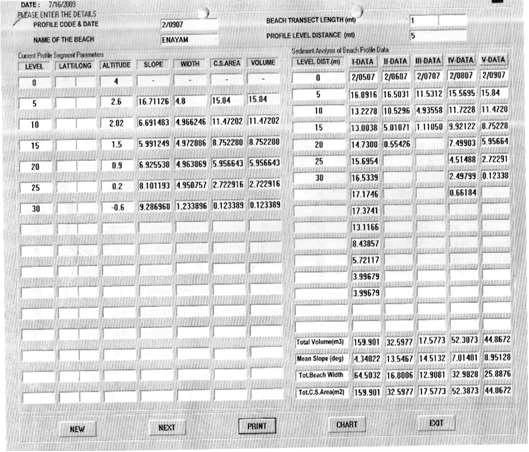
Figures 3 and 4 show screen shots of the developed programmer. The programmer can be used even if the coastal terrain is complex and undulating and the profile survey was performed with other equipment like a transit or a theodolite. If the beach is more undulating, the profile survey can be performed with dense sampling points and two or more change points. The required change point corrections can easily be performed in the BEACH programmer.
Figure 3. Data entry sheet of beach profile.
Figure 4. Volumetric Analysis of beach profile.
The programmer is very user-friendly to load the field data. The raw data from the field book can be directly entered in the visual basic data entry form without any specific format. The elevations of all the profile segments are automatically calculated and displayed in the MS-flex grid. All these field datasets are saved in a Microsoft access database that is linked to this programmer. The validity of the data can be properly verified before it is saved in the database. The stored profile data can be retrieved and edited whenever required. Once the data has been entered in the data entry form, the user can view the complete beach profile in a chart. The fusion chart function of visual basic 6.0 produces attractive standard graphic charts of the profile. The charts can be printed or exported in bitmap image file format.
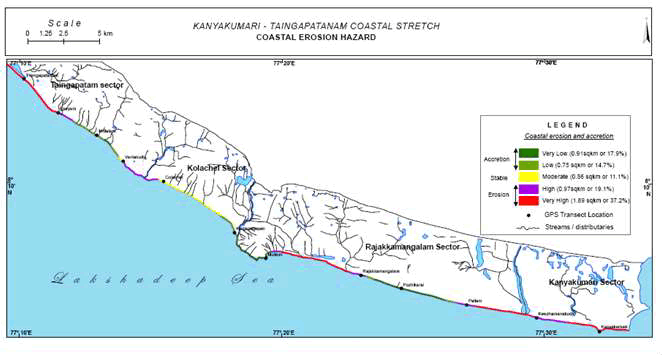
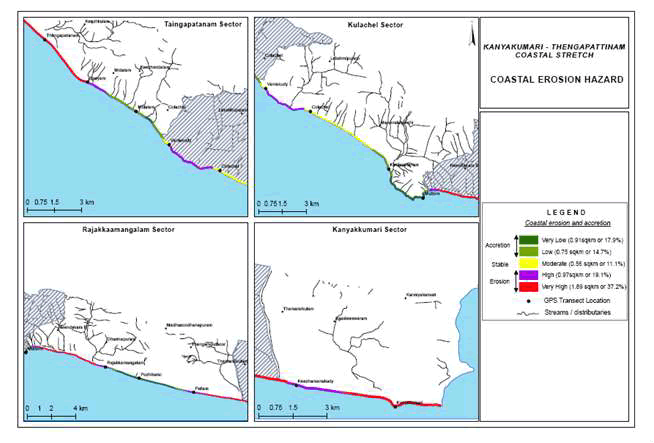
The BEACH programme is committed to visualising the raw beach profile survey data obtained from Emery poles and surveyors levels and also studying the standard morphological and volumetric parameters of beaches. It supports analysis functions like cross-shore beach width, beach slope, cross-sectional area, and sediment volume. The horizontal width, slope, and cross-sectional area of all profile segments can be calculated. The sediment volume of a beach above any user-specified datum, mean beach slope, and cross-shore beach width can also be calculated. A common datum is important for the quantitative analysis of beach profiles with respect to sand transport, erosion, or deposition. So a common datum or a contour level can be used during this analysis. The programme evaluates the changes in slope, beach width, and sediment volume for each and every segment of the beach profile. The net erosion, net accretion, and effective erosion or accretion made on the beach can be calculated. Thus, the programme effectively gives an immediate output after entering the raw field data. In this research, the morphological and volumetric analysis of beach profiles has been done using the programmes the BEACH and BMAP. Beach profiles are measured, from which various pieces of information can be extracted. In this study, profile width is used. Beach width is a measure of the degree of beach change and can be used to gauge the available area of recreational beach above high tide or low tide. This was calculated by measuring the horizontal distance from a fixed landward position (e.g., survey benchmark) to a specified vertical level on the beach (e.g., high tide level, MSL). The construction of a time series of beach width measurements provides an indication as to whether the beach is narrowing or widening. The beach width along the study locations for each month is given in Table 1. Variation in the beach width is used to calculate mean annual beach change rates. If the beach width decreases over time, this is interpreted as an erosion rate, whereas if the beach width increases, this is an accretion rate. The method adopted in this study takes the maximum and minimum mean annual beach change rates for each sector and subdivides this sector into equal intervals. The five relative erosion hazard categories defined are: very high, high, moderate or medium, low, and very low. The very high category would identify those beaches with the highest erosion rates. The results of the beach erosion hazard ranking are presented in Table 2. In this study, the Environmental Systems Research Institute’s (ESRI) state-of-the art Arc GIS 10.1 (GIS) software is used to produce the study area's beach erosion hazard maps. A topographical map is collected from the Survey of India (SOI) on a 1:50,000 scale for the preparation of basic information such as drainage, contours, coastline, roads, and other land use-related information. The paper format of these maps (Sheet Nos. 58-H/4, 58-H/8, and 58-H/12, period 1969 1966) is scanned using an A0 scanner and saved as a TIFF and JPEG image file format with high resolution. Beach erosion hazard maps have been prepared for the entire study area at a scale of 1:50,000. The prepared hazard map for the entire study area is shown in Figure 5, and different coastal sectors are depicted in Figure 6. These maps convey information on beach erosion hazards in a format for technical (e.g., planners, engineers) and non-technical (e.g., landowners, the general public) users.
| S.n | Month | KK | KMY | PLM | POZ | RM | MUT | KDY | COL | VKY | MID | ENA | THEN |
|---|---|---|---|---|---|---|---|---|---|---|---|---|---|
| 1 | Dec’ 06 | 23.15 | 24.55 | 24.55 | 41.78 | 48.55 | 54.92 | 59.84 | 104.4 | 75.6 | 57.82 | 47.85 | 23.92 |
| 2 | Jan’ 07 | 23.44 | 24.6 | 24.6 | 43.54 | 46.59 | 69.96 | 59.79 | 108.2 | 78.98 | 58.19 | 55.44 | 33.85 |
| 3 | Feb’ 07 | 22.87 | 23.66 | 23.66 | 33.17 | 41.08 | 69.93 | 59.83 | 105.3 | 82.16 | 58.34 | 59.45 | 38.63 |
| 4 | Mar’ 07 | 24.89 | 31.97 | 31.97 | 33.62 | 38.45 | 69.95 | 64.84 | 113.9 | 81.32 | 46.32 | 64.63 | 50.83 |
| 5 | Apr’ 07 | 24.28 | 22.91 | 22.91 | 32.16 | 27.25 | 64.96 | 59.82 | 119.8 | 79.89 | 31.02 | 69.7 | 59.88 |
| 6 | May’ 07 | 24.88 | 18.91 | 18.91 | 33.73 | 17.6 | 27.69 | 41.85 | 96.76 | 78.34 | 29.29 | 64.5 | 54.39 |
| 7 | Jun’ 07 | 23.21 | 43.22 | 43.22 | 34.78 | 7.375 | 14.38 | 8.742 | 57.84 | 64.84 | 26.85 | 16.8 | 26.78 |
| 8 | Jul’ 07 | 19.29 | 33.57 | 33.57 | 22.55 | 32.81 | 10.93 | 14.09 | 39.2 | 64.23 | 35.91 | 12.91 | 24.23 |
| 9 | Aug’ 07 | 18.74 | 33.74 | 33.74 | 33.34 | 48.89 | 13.65 | 32.83 | 38.8 | 67.53 | 52.8 | 32.98 | 24.28 |
| 10 | Sep’ 07 | 19.41 | 38.46 | 38.46 | 31.87 | 59.94 | 7.914 | 29.84 | 47.87 | 69.8 | 59.9 | 25.89 | 32.05 |
| 11 | Oct’ 07 | 22.36 | 37.85 | 37.85 | 29.66 | 53.03 | 16.6 | 43.83 | 48.63 | 59.77 | 62.78 | 40.09 | 37.21 |
| 12 | Nov’ 07 | 23.24 | 51.75 | 51.75 | 39.77 | 62.25 | 30.55 | 55.1 | 76.37 | 73.65 | 69.76 | 52.11 | 41.33 |
| 13 | Dec’ 07 | 23.2 | 43.23 | 43.23 | 42.29 | 59.72 | 33.46 | 54.88 | 96.57 | 73.61 | 72.62 | 56.46 | 38.06 |
| Ave | 22.48 | 33.66 | 33.66 | 34.2 | 41.25 | 35.83 | 43.79 | 79.11 | 72.84 | 50.32 | 45.91 | 38.46 | |
| 14 | Jan’ 08 | 23.15 | 24.58 | 24.58 | 42.26 | 47.37 | 72.94 | 59.75 | 89.96 | 76.03 | 52.69 | 50.28 | 45.86 |
| 15 | Feb’ 08 | 23.68 | 27.71 | 33.71 | 41.46 | 45.37 | 54.96 | 69.91 | 95.17 | 84.56 | 52.75 | 51.37 | 35.94 |
| 16 | Mar’ 08 | 21.86 | 30.05 | 33.05 | 34.75 | 37.26 | 71.91 | 64.82 | 104.9 | 82.12 | 49.08 | 59.61 | 45.14 |
| 17 | Apr’ 08 | 22.28 | 26.64 | 26.64 | 33.01 | 27.98 | 68.93 | 58.04 | 115.9 | 82.13 | 37.44 | 64.65 | 41.85 |
| 18 | May’ 08 | 23.29 | 32.16 | 32.16 | 34.74 | 18.36 | 31.63 | 41.51 | 87.76 | 79.87 | 30.62 | 57.73 | 30.39 |
| 19 | Jun’ 08 | 18.65 | 33.7 | 34.7 | 41.76 | 7.069 | 15.97 | 32.87 | 76.36 | 65.85 | 49.83 | 40.76 | 26.31 |
| 20 | Jul’ 08 | 17.95 | 41.77 | 36.77 | 42.31 | 31.57 | 15.27 | 11.43 | 38.65 | 56.9 | 42.31 | 7.186 | 29.24 |
| 21 | Aug’ 08 | 18.14 | 41.76 | 38.76 | 41.46 | 47.26 | 13.22 | 29.84 | 59.9 | 59.81 | 60.89 | 27.14 | 31.73 |
| 22 | Sep’ 08 | 20.46 | 39.75 | 36.75 | 39.79 | 55.38 | 19.94 | 27.74 | 52.9 | 66.5 | 59.92 | 31.06 | 29.58 |
| 23 | Oct’ 08 | 19.36 | 37.23 | 35.23 | 42.3 | 54.33 | 22.05 | 44.86 | 69.93 | 70.03 | 63.81 | 47.38 | 32.16 |
| 24 | Nov’ 08 | 21.25 | 36.23 | 36.23 | 42.3 | 57.37 | 27.46 | 54.86 | 70.07 | 73.38 | 64.79 | 42.84 | 36.77 |
| 25 | Dec' 08 | 22.75 | 27.51 | 25.51 | 52.63 | 58.8 | 47.63 | 44.85 | 87.23 | 76.68 | 60.86 | 49.41 | 41.09 |
| Ave | 21.07 | 33.26 | 32.84 | 40.73 | 40.68 | 38.49 | 45.04 | 79.06 | 72.82 | 52.08 | 44.12 | 35.5 | |
| Note: KK: Kanyakumari;ÃÃÂ?? KMY: Keezhamanakudy; PLM: Pallam; POZ: Pozhikarai; RM: Rajakkamangalam; MUT: Muttom; KDY: Kadiapattanam; COL: Colachel; VKY: Vaniakudy; MID: Midalam; ENA: Enayam; THEN: Thengapattanam | |||||||||||||
Table 1. Beach width(m) of the study area.
| Sector | Erosion Hazard Categories: Erosion (-)/Accretion(+) Ranges (m/yr) | Location | Beach width (m) 2007 |
Beach width (m) 2008 |
Beach change rate:Erosion (-) accretion (+) (m/yr) | Hazard ranking |
|---|---|---|---|---|---|---|
| Kanyakumari | Very High: less than -2.0 | Kanyakumari | 22.48 | 21.07 | -1.41 | High |
| High: -2.0 to -0.2 | Keezhamanakudy | 33.66 | 33.26 | -0.4 | High | |
| Rajakkamangalam | Moderate: -0.2 to 0.2 | Pallam | 33.66 | 32.84 | -0.82 | High |
| Low: 0.2 to 2.0 | Pozhikarai | 34.2 | 40.73 | 6.53 | Very low | |
| Very low: greater than 2.0 | Rajakkamangalam | 41.25 | 40.68 | -0.57 | High | |
| Kolachel | Muttom | 35.83 | 38.49 | 2.66 | Very low | |
| Kadiapattanam | 43.79 | 45.04 | 1.25 | Low | ||
| Colachel | 79.11 | 79.14 | -0.05 | Moderate | ||
| Vaniakudy | 72.84 | 72.82 | -0.02 | Moderate | ||
| Taingapatanam | Midalam | 50.32 | 52.08 | 1.76 | Low | |
| Enayam | 45.91 | 44.12 | -1.79 | High | ||
| Thengapattanam | 38.46 | 35.5 | -2.96 | Very High |
Table 2. Beach erosion hazard ranking of the study area.
Figure 5. Coastal erosion hazard map of the study area.
Figure 6. Coastal erosion hazard map of four coastal sectors.
Results and Discussion
Coastal erosion is much more localised and depends on the geomorphology and coastal dynamics of the region. Some sections of sandy beaches will erode, while another section close by will accrete sand. The beach profile study indicates that the study area has experienced both erosion and accretion. The shoreline changes are carried out with reference to January 2007, since the fair weather season starts in January. The erosion may be a short-term (order of hours to seasons) process that reflects adjustment to wave energy changes or a longer term (order of years) one that reflects an increasingly deficient beach sediment budget. On sandy beaches, short-term changes involving erosion are commonly part of the morphodynamic cycle of adjustment of the beach profile to seasonal or non-seasonal changes in wave energy. Seasonal changes commonly correspond to the profile flattened by the monsoon season and the summer profile that accretes under fair weather conditions. The loss of beach sand usually corresponds to a grain of sand in the near-shore region, and vice versa. Human activities and artificial structures like groynes and RMS walls can influence both beach loss and gain. The Kanyakumari sector has experienced net erosion. In the Kanyakumari sector, the profile survey has been carried out in three stations, namely Kanyakumari, Keezhamanakudy, and Pallam. Erosion is observed on all three beaches.
Pallam has experienced more erosion, but the Keezhamanakudy coast has seen a little erosion. In the Rajakkamangalam sector, all the selected beaches except the Rajakkamangalam beach have experienced accretion. The Pozhikarai coast has experienced small accretions. Rajakkamangalam Beach's shoreline indicates erosion.
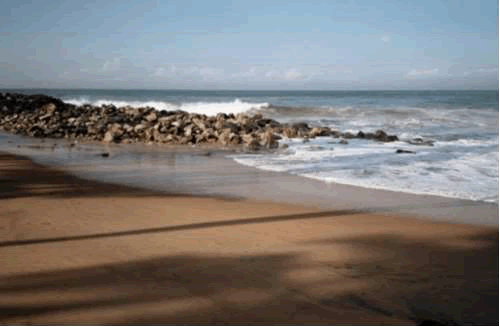
The series of groynes present in Periakad influences the accretion and erosion trends in this sector. In the Colachel sector, the profile survey has been carried out in four stations, namely Muttom, Kadiapatanam, Colachel, and Vaniakudy Coast. All the beaches along this sector have been noted as stable. Particularly the Muttom coast has experienced more accretion. Kadiapatanam Beach indicated little accretion in the study. The rocky nature and groynes presence in the region are responsible for the stable coast in the region. The present study also indicates that erosion is dominant in the Thengapatanam zone. The Thengapatanam and Enayam beaches have experienced more erosion, but Midalam qualified for accretion.
The low inflow of littoral drift movement into the Thengapatanam beach by the Thamiraparani river and the collision of high-energy waves at the edge of the RMS wall at Thengapatanam are the reasons for the erosion in the Thengapatanam. The presence of groyne structure at Enayam changes longshore current movement, and little erosion took place in the Helen colony. The stopping of sand mining in Midalam is the reason for the accretional trend in the area.
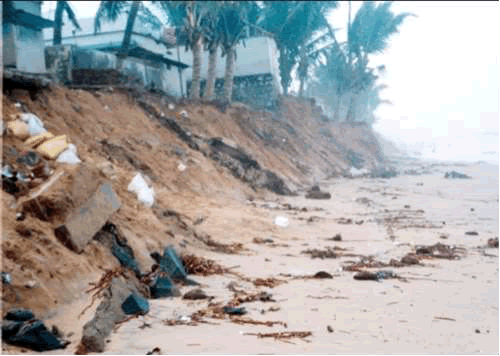
At Kanyakumari, the beach change mainly falls under the high (-2.0 to -0.2 m/yr) erosion hazard category. This erosion occurred in all months except March and May in the year 2007. During the year 2008, similar results were obtained. The presence of cliff regression on the coast is clear evidence for the high erosion nature of the coast in all three locations of this region. The coarse sand is present predominantly during all the months, indicating high wave energy. As compared to other stations, at Pozhikarai and Muttom, the coastal erosion hazard comes under the very low category (accretion greater than 2 m/yr). In both locations, the sediment transport is higher than in other stations due to the natural promontory located at Muttom and the groynes group at Periakad. The fine sand present in Muttom and free wave oscillations at both stations indicate an accretion trend. At stations Colachel and Vaniakudy, the coastal hazard comes under the moderate category annually (-0.2 to 0.2 m/yr), but a high hazard is observed during the June to November months. The rocky coast and offshore hillocks presence in the region may be the reason for a lower erosion hazard. The coastal hazard is low (accretion 0.2 to 2.0 m/yr) in Kadiapattanam and Midalam. The high erosion hazard takes place in the SW and NE monsoon months in Kadiapattanam, but the high erosion hazard occurs during the March to June months in Midalam station. The coastal hazard category comes under the very high category (less than -2 m/yr) in Thengapattanam Beach among the study locations. The erosion was very high in all months except March to May in 2007 and 2008. The more damming of the Tamirabharani river causes sediment starved shorelines, low-lying topography, and a highly damaged toe of the RMS wall (Figure 7) in the beach, which are the major reasons for the very high erosion hazard of this beach. Keezhamanakudy, Pallam, Rajakkamangalam, and Enayam beaches are identified as high erosion hazard categories (-2.0 to -0.2 m/yr). All the beaches have high wave energy. Rajakkamangalam has erosion due to the presence of groynes on the eastern side and showed an erosion trend from January to July during 2007 and 2008. The erosion trend at Rajakkamangalm is shown in Figure 8. The erosion is noticeable during the monsoon months of June to December in Enayam too. The Pallam and Keezhamanakudy beaches are highly eroded from January to May, unlike other beaches, because of the calcareous rocks underneath. This has less impact during the fair weather period (January to May).
Figure 7. Highly damaged toe of R.M.S. wall at Thengapattanam beach.
Figure 8. Erosion at Rajakkamangalam during SW monsoon.
In order to prevent erosion hazards in the region, the following mitigation methods could be implemented: In order to prevent erosion, people build RMS wall structures. But these structures may be helping to accelerate the erosion hazard or cause the loss of nearshore habitats and beaches. The scour of sediment from the bulkhead leads to a deepening of the water and the loss of intertidal habitats like marshes and beaches. Seawalls and bulkheads deflect the energy of waves as opposed to native vegetation, which absorbs and buffers the energy. While construction of dams across rivers is unarguably necessary for irrigation and electricity generation, there should be adequate provision for letting water through the downstream courses at least during peak flows so that deltas are not starved of the much-needed sediment inputs for coastal stability.
Similarly, remobilization of sediments that are currently trapped in reservoirs may also be accomplished through appropriate engineering methods, which would have the double benefit of maintaining the reservoir capacity as well as the sediment budget at the deltas and littoral drift along the coast. Artificial reefs may be constructed in the off-shore region within 50 m of the shoreline. Coastal vegetation and beach nourishment techniques are encouraged to reduce coastal erosion hazards. The very high erosion hazards of the beaches should be protected by groyne structures as soon as possible. The Mulloorthurai coastal hamlets of Azickal and Chotavilai can be protected by Groynes. The high-erodibility beaches of Rajakkamangalam, Helen Nagar, Kodimunai, and Keezhamanakudy can also be protected by coastal vegetation and beach nourishment techniques.
Conclusion
A C++ programme is developed to calculate the erosion hazard category of the study area as the range of erosion is known. The same programme can be easily modified by varying the erosion and accretion range of any coastal region. The location and erosion/accretion range of the particular beach should be taken as input data. Initially, the entire erosion and accretion rate of the study area in m/yr is classified into 5 categories. The net erosion of the beach has been taken as a negative value and the net accretion as a positive value. The erosion hazard value is less than -2 m/yr, known as ranking very high. The erosion hazard value lies between -2 and -0.2 m/yr, which is taken as an erosion hazard ranking as high. If the erosion or accretion hazard value is between -0.2 and 0.2 m/yr, it is termed a moderate erosion hazard ranking. When the beach is accreted with values of 0.2 to 2.0 m/yr, hazard ranking is low, and if it is more than that, accretion can be known as erosion hazard ranking, which is very low. The type of erosion hazard ranking can be easily calculated by using this simple programme. The developed flow chart and C++ programme are given in the annexure.
Acknowledgments
The authors are thankful to the joint secretary, University Grants Commission (UGC), SERO, Hyderabad, for providing the financial assistance under the Minor Project Scheme (MRP.812/05, Link No. 1812.0).
References
- Basco DR (1999). Overview of beach engineering in the United States of America, final report, coastal engineering centre. Old Dominion University, Virginia. 116.
- Batten B, Salgado G, Mclaughlin E, Bokuniewicz H (2002). Beach profile analysis and database development, report to New York Department of State, Working Paper 1232, Marine Sciences Research Center. Stony Brook University. Stony Brook, New York, USA. 35.
- Bird ECF (1985). Coastline changes: A global review. John Wiley. UK. 219.
- Black KP, Kurian NP, Baba M (2008). Open coast monsoonal beach dynamics. J. Coast. Res. 24(1):1-12.
- Brown I, Jude S, Koukoulas S, Nicholls R, Dickson M, Walkden M, Jones A (2004). Dynamic simulation and visualisation of coastal erosion: Past, Present and Future, GISRUK04. Comput. Environ. Urban. Syst. 30(6):840-860.
- Chandrasekar N, Sheik Mujabar P (2010). Computer application on evaluating beach sediment erosion and accretion from profile survey data. Comp. Geosci. 14:503–508.
- Chunting Xue (1996). Coastal erosion and management of Amatuku island, Funafuti Atoll, Tuvalu. SOPAC Technical Report. 234.
- Clayton K (1995). Predicting sea-level rise and managing the consequences. Environmental Science for Environmental Management. 2nd Edition. John Wiley and Sons. New York, USA.
- Cooper NJ, Pethick JS (2005). Sediment budget approach to addressing coastal erosion problems in St. Queen's Bay, Jersey, Channel Islands. J. Coast. Res. 21(1):112-122.
- Cooper NJ, Leggett DJ, Lowe JP (2000). Beach-profile measurement, theory and analysis: Practical Guidance and applied case studies. J. Chart. Inst. Water. Environ. Manag. 14(2):79-88.
- El-raey M, Sharaf el-din SH, Khafagy AA, Abo Zed AI (1999). Remote sensing of beach erosion/accretion patterns along Damietta Port Said shoreline, Egypt. Int. J. Remote Sens. 20(6):1087-1106.
- Guillen J, Stive MJF, Capobianco M (1999). Shoreline evolution of the Holland coast on a decadal scale. Earth Surf. Process. Landf. 24(6):517–536.
- Hentry C, Chandrasekar N, Saravanan S (2013). Beach dynamics of Colachel open coast, Kanyakumari District (SW India). J. Coast. Res. 57(1):75-95.
- Keqi Zhang, Bruce C. Douglas, Stephen P. Leatherman (2004). Global warming and coastal erosion. Clim. Change. 64:41–58.
- Krause G, Soares C (2004). Analysis of beach morphodynamics on the Bragantinian mangrove peninsula (Para, North Brazil) as prerequisite for coastal zone management recommendations. Geomorph. 60(1):225–239.
- Kurian NP, Shahul Hameed TS, Baba M (1985). A study of monsoonal beach processes around Alleppey, Kerala. Proc Indian Acad Sci Earth Planet Sci. 94:323–332.
- Malini H, Rao KN (2004). Coastal erosion and habitat loss along the Godavari delta front – a fall out of dam construction (?). Curr Sci. 87(9):123–126.
- Perumal S. Bhagavathi, Thamarai P (2008). Lithological studies of soils strata along the coastal area of kanyakumari to Colachel coastal belt, South Tamilnadu, India. Int. J. Appl. Environ. Sci. 3(2):177-184.
- Samsuddin M, Suchindan GK (1987). Beach erosion and accretion in relation to seasonal longshore current variation in the northern Kerala coast, India. J. Coast. Res. 3:55–62.
- Shahul Hameed TS, Kurian NP, Thomas KV, Rajith K, Prakash TN (2007). Wave and current regime off the southwest coast of India. J. Coast. Res. 23(5):1167–1174.
