Research Article - (2023) Volume 11, Issue 1
Estimation of technical efficiency of Sorghum production in Dejen district, North-Western Ethiopia
Kassa Chanie1* and Tsegaye Molla22Department of Agricultural Economics, Debre Markos University, Debre Markos, Ethiopia
Received: 26-Aug-2022, Manuscript No. AAFSF-22-72998; Editor assigned: 29-Aug-2022, Pre QC No. AAFSF-22-72998(PQ); Reviewed: 12-Sep-2022, QC No. AAFSF-22-72998; Revised: 17-Jan-2023, Manuscript No. AAFSF-22-72998(R); Published: 24-Jan-2023, DOI: 10.51268/2736-1799.23.11.090.
Abstract
Background: In Ethiopia, cereal crops are a large part of the agricultural sector, of which sorghum accounts for the third largest portion of the cereals. However, Ethiopian agriculture is characterized by low productivity due to natural, social, economic, and institutional factors. Farmers with homogeneous resources produce different outputs per hectare due to inefficient utilization of limited resources. There is no due attention given to crop production efficiency issues, particularly in the country's sorghum production. The overall objective was to assess level of technical efficiency and its determinant factors in Dejen district, North-Western, Ethiopia.
Methodology: Using a two stage sampling procedure a total of 192 sorghum producer sample households was selected. The study employed both descriptive statistics and econometric analysis. The Cobb-Douglas production functional form of the stochastic frontier model was used for econometric analysis.
Results: In the Cobb-Douglas stochastic frontier model, the estimated coefficients revealed that land, labor, oxen power, seed, and fertilize are significant explanatory variables that influence household output levels positively. While, the inefficiency model explanatory variables; education, family size, farm experience, livestock holding, extension contact, credit access, and training determine technical efficiency significantly and positively, whereas plot distance significantly and negatively determined technical efficiency in the study area.
Conclusion: According to our studies, the average technical efficiency of sorghum producers was 62.8%, with a minimum of 23.5% and a maximum of 96.7%. The estimated gamma (γ) value was 73.4% which indicates that the large portion of the error term was due to the presence of inefficiencies in resource utilization, resulting in output variation. On average, there is about 37.2% of output variation from the optimal production for each farmer in the study area. Farmers in the study area can improve this output variation by utilizing existing resources and technology efficiently. Therefore, it should be given due attention to strengthening adult education and establishing the required facilities; appropriate and adequate extension services should be provided for sorghum producers; provision of improved veterinary services, feed, and water supplies should be encouraged, and credit providing institutions like micro finances should be established and expanded in the study area.
Keywords
Stochastic frontier, Cobb-Douglas, Technical efficiency, Sorghum production, explanatory variables.
Introduction
It has been cultivated for centuries as a staple food crop in most of the sub-Saharan African and Asian countries. It has also better adaptation and resistance to high temperatures and drought stresses. It is capable of growing in areas of high temperature, inadequate and erratic rainfall, in soils with poor structure, low fertility, and low water holding capacity. In developing countries, sorghum is consumed by over 500 million people as their major source of food. In Ethiopia, the agricultural sector contributes an indispensable role in enhancing economic growth and bringing development contributing 33.3% of GDP, 80% of employment, 81% of foreign earnings, and providing about 70% of the material for the domestic industries. Cereal crop production accounts for the largest share of the sector. Most agricultural holders derive the food they consume and the money they demand to fulfill their daily expenses from agricultural activities. About 4.34 million tons of sorghum is produced per year In Ethiopia, with an estimated average yield of 2.4 tons per hectare In terms of number of growers, area coverage, and volume of production, it is the third largest and major cereal crop after maize and ten in the country. It could be a crop dominated by resource poor smallholders and typically produced under adverse conditions within the eastern and northwest parts of Ethiopia, where there is low rainfall. It is used for preparing local drinks (beverages), for making bread, and ‘Injera’. The whole plant with sorghum stalks is used for house construction and cooking fuel, and leaves are also used as animal fodder (Abate TM, et al., 2019).
Under Ethiopia’s Growth Transformation Plan (GTP), agriculture was emphasized to enhance productivity and production which is crucial for the country's effort to realize food security and increase export earnings (Asfaw S, Shiferaw BA, 2010). However, increasing population pressure with a rate of 2.46 percent, coupled with low levels of agricultural productivity is a critical problem within the country (Baruwa O, Oke J, 2012). These have aggravated food insecurity status by widening the gap between demand and supply interaction. Consequently, Ethiopia is suffering from food insecurity and is unable to satisfy domestic food demand (Battese GE, Coelli TJ, 1995). Attempting to disseminate new technologies and utilization modern factors of production to improve agricultural productivity is the strategy of the Ethiopian government. However, as stated by where there is inefficiency in the utilization of agricultural inputs, trying to introduce new technology might not bring the expected result. The inefficiency in production is the result of inefficient use of limited resources. The inefficiency in production is the result of inefficient use of limited resources and technology. Efficiency estimation in agricultural production is a very essential and important decision in the use of scarce resources to improve productivity and for reformulating agricultural policies. Empirical studies such as those have been conducted to measure agricultural production efficiency in Ethiopia. However, there is no information on the efficiency of sorghum production in the study area. The extent, causes, and possible measures of the efficiency factors for sorghum producer farmers are not yet given enough emphasis. Therefore, this study attempted to estimate farmers technical efficiency in sorghum production and identify its determinant factors in the study area (Burke JJ, et al., 2013).
Materials and Methods
Description of the study area
The study was conducted in Dejen district (Figure 1). Located in North-Western Ethiopia at 336 km south of the regional state capital, Bahir Dar, and 229 km North West of the capital city of Ethiopia, Addis Ababa (Coelli TJ, 1995). The district lies between longitude 38º6’ E and 38º 10’ E, and between latitude 10º 7’ N 10º 11’ N, with an elevation of 1071 and 3000 Meters Above Sea Level (M.A.S.L). Annual average temperatures in the district are between 20oC and 24oC, and total rainfall is between 800 mm and 1200 mm (Coelli TJ, et al., 2005). In terms of climatic zones, the District is categorized into three, 41% highland, 31% midland, and 28 % lowland. The district consists of 21 rural kebeles and 1 town administration. The district has a total population of 95,483, of which 45,952 are males and 49,531 are females (East Gojjam zone finance and economic development guidance, a statistical report of all district 2015). Mixed farming is the main livelihood system in the district, where crops and livestock are produced together (Degefa K, et al., 2017).

Figure 1. Geographical location of the study area. Source: own design using Are GIS 10.7.
Data collection methods
To achieve the objective of this study both primary and secondary data was collected. Primary data was collected through key informant interviews, focus group discussion, and from a cross sectional sample of representative farm households through questionnaires, in the 2019/20 production season. Secondary data were also collected from unpublished and published documents (Derese SA, et al., 2018).
Sampling procedure
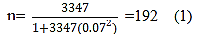
The two stages sampling procedure was employed for this study (Dessale M, 2019). Firstly, three sorghum producer kebeles were selected out of seven sorghum producer kebeles using a simple random sampling technique (Haile K, et al., 2019). Secondly, households were chosen by using systematic random sampling from each kebele based on proportion to sample size. As presented in Table 1, a total of 192 sample households had been drawn using the sample size determination formula (Hazarika C, Subramanian S, 1999).
| Sample Kebeles | Sorghum producer farmers | Sample size |
|---|---|---|
| Minji yibiza | 1501 | 86 |
| Gelgele | 1381 | 79 |
| Amarit | 465 | 27 |
| Total | 3347 | 192 |
Source: Own computation from sample frame, 2019/20
Data analysis
To address the objective of these study descriptive and econometric analyses were used. Descriptive analysis is essential to study the distribution of variables and provide a quick description of respondents (Kibret SA, 2016). In this study, descriptive tools prefer to mean, variance, minimum, maximum, frequency, and percentage. The stochastic frontier model was used for econometric analysis (Kinfe H, Tesfaye A, 2018).
Model specification
This study employed the stochastic frontier functional approach, which needs the prior specification of the production function to estimate the amount of technical efficiency. Among the possible algebraic forms, Cobb-Douglas and trans log functions are the foremost popularly used models in most empirical studies of agricultural production analysis. The cobb-Douglas functional form has advantages over the other functional forms therein it provides a comparison between the adequate fit of the data and computational feasibility and is convenient in interpreting elasticity of production and it is very parsimonious with relevant degrees of freedom which are widely used in frontier production function studies (Meeusen W, Broeck VDJ, 1977).
On the other hand, the cross-product effects of the explanatory variables have a major role in the maximum likelihood estimation, and the trans log model fits better. This functional form allows flexibility in providing an approximation to any twice differentiable function and for its ability to capture interaction among inputs (Mohammed Z, 2018).
Therefore, before proceeding to the estimation of technical efficiency and inefficiency effects (determinants), a hypothesis test was done to choose the appropriate model between the restrictive Cobb-Douglas functional form in preference to the more flexible trans log model, which specifies the coefficients of the interaction terms and the square specifications of the input variables under the trans log specifications equivalent to zero (Shrestha CM, 1992). The test was made based on the value of Likelihood Ratio (LR) statistics, computed from the log likelihood value obtained from the estimation of Cobb-Douglas and trans-log functional specifications as follows.
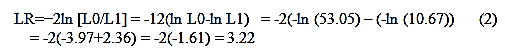
Where L0 was the likelihood function for Cobb-Douglas and, L1 was the trans log model for sorghum production with a value of -53.05 and 10.67 respectively. The hypothesis test result was found to be 3.22. This value is less than the critical chi-square value of (12.34) at 5% significance level with (22) degrees of freedom. Hence, it failed to reject the null hypothesis. The trans log model turns into Cobb-Douglas when all the square and interaction terms in the trans log are zero. This indicates that to fit the data for the estimation of technical efficiency of sorghum producer farmers in the study the Cobb-Douglas production function was the best fit model. Multicollinearity among explanatory variables of the production function, and the inefficiency effect model were checked using variance inflation factor for continuous variables and contingency coefficient for categorical variables. The result indicated that there were no Multicollinearity problems in both production function and inefficiency models (Son TVH, et al., 1993).
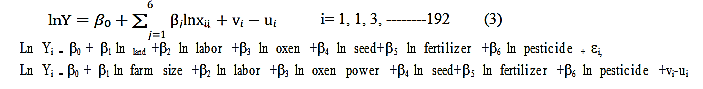
In stochastic frontier analysis, the error term splits into two parts (technical inefficiency and random shock component) to accommodate factors that are purely random and are out of the control of the firm. A Cobb-Douglas stochastic production frontier given by for cross sectional data takes the form:
Where,
Ln=the natural logarithm
εi=vi-ui, which is the residual random term composed of two elements vi and ui.
Vi=Random noise (white noise) which is N (0, σ2)given the stochastic structure of the frontier that permits a random variation in output due to factors such as weather, measurement error, omitted variables, and other exogenous shocks.
Ui=Inefficiency effect which is non-negative, half normal distribution (0,σ2) allowing the actual production to fall below the frontier but without attributing all shortfalls in output from the frontier as inefficiency distributed random error.
Technical Efficiency (TE) measures the output of producer i relative to the output that could be produced by a fully efficient producer using the same input vector. TE of producer i is the ratio of actual output relative to the frontier output, as suggested by Timothy J, et al.
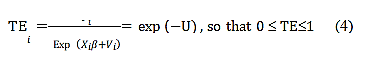
Where; γi is estimated as exp 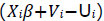 , and is the actual output which is obtained in the presence of the technical inefficiency effects.
  is the corresponding frontier output under the condition of random shocks (Torkamani J, Hardaker JB, 1996). When dividing the actual output by the frontier output, the remaining
 represents technical inefficiency. The score of technical efficiency lies between 0 and 1 (0 ≤ TE ≤ 1).
The technical inefficiency model was employed to analyze and identify influencing factors of technical efficiency. In the technical inefficiency model, the dependent variable is the technical inefficiency variable (Ui) and the explanatory variables are the factors that are hypothesized to affect technical inefficiency (Zi). In a technical inefficiency model a positive sign of a coefficient indicates that a variable has a decreasing effect on technical efficiency. The implication of the relationship is that variables that increase technical inefficiency will decrease technical efficiency (Yemane T, 1967).
The empirical specification of the technical inefficiency model for this study is as follows:
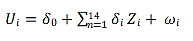
Where, Ui is the technical inefficiency variable which is assumed to be a function of farm specific socio economic and farm management variables. The farm explanatory variables (Zi) hypothesized to affect producers’ level of technical inefficiency were sex, age, education, farm experience, family size, extension contact, land ownership, livestock holding, off farm activity, credit access, market distance, training, number of plots and plot distance. The inefficiency model is presented as:
Ui=δ0+δ1 sex+δ2 age+δ3 education+δ4 family size+δ5 farm experience+δ6 extension contacts+δ7 land ownership+δ8 livestock holding+δ9 off farm income+δ10 credit+δ11 market distance+ δ12 training+δ13 number of plots+δ14 plot distance+wi
Where;
Ui≡Inefficiency effect,
δi≡parameter vectors associated of inefficiency effect to be estimated,
wi≡a random variable.
The Likelihood function is expressed in terms of the variance parameterization given by sigma square (σ2) and gamma (γ). Variance the parameters, σ2 and γ were used for testing presence of technical inefficiency. σ2 refers to the total model variance consisting of a variance due to random effects (σv2) and a variance due totechnical inefficiency effects (σu2) which isparameterized as σ2=σv2+σu2. The total modelvariance ′γ′ which constitutes the technical in efficiency is calculated from estimated variance parameters σu2 and σ2. The parameterizations ofgiven by Battese and Coelli takes the form:
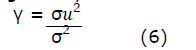
γ ranges between zero and one. When γ is zero, it indicates that technical inefficiency effects are absent in the data. The implication is that the estimated SFA model reduces to a simple OLS regression since all variation is due to random noise. When is closer to one, the model indicates that most of the variation in output is due to technical inefficiency and therefore, confirms the appropriateness of SFA technique to evaluate the data.
Results and Discussion
Before proceeding to the estimation of technical efficiency and inefficiency effects (determinants), it is necessary to test the appropriate functional form. The hypothesis test was to choose the appropriate model between the Significant and positively related to the production of sorghum in the study area.
Maximum likelihood estimates of stochastic frontier model parameters
The maximum likelihood estimates of parameters of the stochastic production frontier were obtained after treating the datasets with STATA version 14.1. The Cobb-Douglas stochastic production frontier model was tested and found to be the best to fit the data. It was used to estimate the efficiency of sorghum producer farmers, and to identify determinant factors influencing the inefficiencies in sorghum production.
The input variable coefficients were estimated under the full frontier production function (MLE). The estimation was computed in a single estimation procedure using STATA version 14.1 and gave the value of the Log likelihood function for the stochastic production function.
As indicated in Table 2, the estimated ML coefficients showed that the coefficients of the input variables; land size, labor, oxen power, seed quantity, and fertilizer were found to be significantly related to sorghum production.
The coefficients of area assigned for sorghum, labor, oxen, and fertilizer were positive and statistically significant at a 1% significance level. Seed was also positively and statistically significant at a 5% significance level (Table 2).
The input coefficients for area under sorghum, labor, oxen, seed quantity, and fertilizer are 0.3720 0.2699, 0.1311, 0.1932, and 0.2154 respectively. Therefore, the increasing amount of the inputs; the area under sorghum production, family labor, oxen, seed quantity, and fertilizer by one percent will increase output by a percent of each coefficient.
This implies that the existing inputs were not optimally used, and yields could be increased by using additional inputs argue that stage I is inefficient because the addition of an extra unit of the firm should never produce.
Summing the individual elasticity yields a scale elasticity of 1.18. This showed that farmers are facing increasing returns to scale, and depicts that there is potential for sorghum producers to increase their production utilizing the existing resources and technology.
Therefore, there is production inefficiency in the study area. So, there is a potential to increase production with an increasing rate using existing resources.
The table below indicates the maximum likelihood estimate of the Cobb-Douglas production function frontier model input variables such as land allocated for sorghum, labor, oxen power, seed, fertilizer, and pesticide, of the first five variables were significantly and positively related to the production of sorghum in the study area.
| Variable | Parameter | Coefficient | Std.Err | Z-value |
|---|---|---|---|---|
| Constant | β0 | 1.4948*** | 0.2582 | 5.79 |
| Ln (Land) | β1 | .3720*** | 0.0567 | 6.56 |
| Ln (Labor) | β2 | .2699*** | 0.0284 | 9.5 |
| Ln (Oxen) | β3 | .1311*** | 0.0478 | 2.74 |
| Ln (Seed) | β4 | .1932** | 0.0387 | 4.99 |
| Ln (Fertilizer) | β5 | .2154*** | 0.0259 | 8.31 |
| Ln (Pesticide) | β6 | 0.0099 | 0.0273 | 0.36 |
| Elasticities | 1.18 | |||
| Variance parameters | ||||
| Sigma-squared: σ2u+σ2v | σ2 | 0.0248 | ||
| Lambda: σu/σv | λ | 1.6635 | 0.0195 | |
| Gamma: σ2u/σ2 | γ | 0.7345 | 0.2346 | |
***Denotes significant at 1% and 5% respectively.
Source: Own computation, 2019/20.
Technical efficiency score of sorghum producers
The average level of technical efficiency of sorghum producer sample households was about 62.8%, with a minimum and a maximum technical efficiency level of 23.5% and 96.7%, respectively (Table 3). This indicates the presence of variation in technical efficiency level among sorghum producer farmers. This variation in the efficiency level indicated that there is a chance for improving the existing level of sorghum production through enhancing the level of farmers technical efficiency.
The mean level of technical efficiency further tells us that the level of sorghum yield of the sample households could be increased, on average, by about 37.2%, if appropriate measures are taken to improve the technical efficiency level of sorghum producer farmers. In other words, there is a possibility to increase output of sorghum by about 37.2% using resources at an efficient manner without introducing any other improved inputs and practices.
| Variable | Obs. | Mean | Std. Dev. | Min | Max |
|---|---|---|---|---|---|
| Efficiency | 192 | 0.62803 | 0.151579 | 0.234506 | 0.966902 |
Source: Own computation, 2019/20
As presented in Figure 2, it is observed that about 46.88 % of the sample households were operating below the overall mean level of technical efficiency while about 3.6 % of the households were operating at the technical efficiency level of more than 90%. Whereas, about 53.2% were able to get above the mean level of technical efficiency. So, in the long run, besides improving technical efficiency, further efforts are required to introduce other best alternative farming practices and improved technologies in order to improve the overall sorghum production level.

Figure 2. Efficiency score distribution of sample households. Source: Own computation, 2019/20.
Maximum likelihood estimates for determinants of inefficiency model
The estimated level of technical efficiency among smallholder farmers is not enough to derive recommendations for policy intervention. It is also necessary to identify the sources of variation in the technical efficiency estimates among the farmers and quantify their effect. Since, measuring its magnitude, identify the major factors causing this inefficiency level is the next most important objective of the study. As different Empirical studies on efficiency showed that the determinants of inefficiency were very considerable and highly dependent on demographic and other characteristics of a farmer, resource endowment factor, and institutional factors. Therefore, those factors were considered as determinants of inefficiency in this study by assuming other determinants kept constant.
The coefficients of those socio economic and institutional variables included in the inefficiency model were estimated simultaneously by the single stage maximum likelihood estimation procedure using the estimated level of technical efficiency as the dependent variable. According to in the analysis of the technical inefficiency effects model, the sign of coefficients of the regression result are interpreted inversely for technical efficiency. The positive sign of coefficients in the inefficiency model indicates the decreasing in the level of technical efficiency of the farmer and vice versa. Thus, the opposite signs of the coefficients of the variable in the model result may be required which readers should keep in mind while reading this section. Out of fourteen explanatory variables included in the inefficiency model for this study, about eight explanatory variables were statistically significant, whereas, the rest six explanatory variables were not statistically significant (Table 4).
| Variable | Parameter | Coefficient | Std.Err | Z-value |
|---|---|---|---|---|
| Constant | δ0 | 1.1058* | 0.5103 | 2.17 |
| Sex | δ1 | 0.0063 | 0.33666 | 0.02 |
| Age | δ2 | 0.0009 | 0.0155 | 0.06 |
| Education | δ3 | -.2816*** | 0.0476 | -5.91 |
| Family size | δ4 | -.1289* | 0.0261 | -4.93 |
| Farm experience | δ5 | -.0225** | 0.0112 | -2.02 |
| Extension contacts | δ6 | -.3468* | 0.1913 | -1.81 |
| Land ownership | δ7 | 0.0002 | 0.0053 | 0.05 |
| Livestock holding | δ8 | -.2191*** | 0.0349 | -6.27 |
| Off farm income | δ |
-0.0087 | 0.0149 | -0.58 |
| Credit | δ10 | -.2260*** | 0.0338 | -6.67 |
| Market distance | δ11 | -0.0347 | 0.0861 | -0.4 |
| Training | δ12 | -.1722** | 0.0775 | -2.22 |
| Number of plots | δ13 | 0.0165 | 0.1363 | 0.12 |
| Plot distance | δ14 | .1591** | 0.1036 | 2.54 |
***, **, * denotes significant at 1%, 5%, and 10% respectively.
Source: Own computation, 2019-2020.
As indicated in Table 4, the estimated coefficient of education status in the inefficiency model was negatively significant at a 1% significance level. This indicated that as a farmer is more educated his/her level of technical efficiency increases and vice versa. This result supported the findings. This may be attributed to the orientation of most farmers in the study area where more than 65 percent didn’t read and write. Household size was found to affect technical inefficiency negatively at 10 percent significance level, this agreed with the finding of, which had a positive effect on the level of technical inefficiency. This study indicated that households with larger family sizes were more technically efficient than those having smaller families. This may be attributed to the factors that households consume more food and therefore strive to achieve higher output. In addition, these households have more labor available for timely implement agricultural management activities.
Farm experience: The estimated coefficient of farming experience is positive and significant at a 5 percent significance level. This suggested that the more experienced a farmer is the higher the probability that farmers being more efficient. This indicates farmers having more experience can make accurate predictions on when and how to sow, what inputs to use, what quantity of seed to use as well as the timing of the use of these inputs and are therefore more efficient in the use of these inputs as compared to less experienced farmers. This finding is in line with the finding of Mohammed.
Extension contacts: The coefficients of extension contact were statistically significant at 10 percent level of significance, and positively influence the technical the efficiency of sorghum producers. Farmers that have frequent visits by development agents improve farmers technical efficiency because farmers can share skill and knowledge from experts, that helped to apply on sorghum production activities. The chance that farmers who have frequent visits are more important for modern agricultural input mobilization which enables them to reduce technical inefficiency. Hence, in the study area there needs to provide extension services and continuous support of farmers by development workers. The contribution of an increasing number of visits of farmers with extension agents can reduce the gap between the efficient and inefficient sorghum producer farmers in the study area. As such situation initiates farmers to adopt agricultural technologies which help farmers to improve their efficiency level in sorghum production. This result is supports finding of Sibiko, et al.
Livestock holding: Livestock holding (TLU) was an important variable that statistically significant at 5 percent significance level, and positively determined the technical efficiency of sorghum producer farmers This might be due to the reason that the livestock size directly imposes implication on technical the efficiency of farmers in sorghum production as it is a major source of a liquid asset, transportation service, manure, and draft power during the plowing season. This result is consistent with other empirical works of Haile, et al.
Access to credit: Credit availability can solve the problem of the cash constraint and enabling the farmers to purchase agricultural inputs timely. As shown in Table 4, credit is statistically significant at a 1 percent significance level, and positively determines the technical efficiency of sorghum production. Farmers that can get access to credit are more efficient than those who had not get credit access. This is in line with the findings of Mengistu and Mohammed.
Training: Coefficient of training was positively significant at 5 percent significance level. This may be because training shares information for the farmers in terms of input utilization, soil conservation with multipurpose vegetative crops, risk aversion, storage, and handling systems.
Plot distance: Distance is also another variable influencing the technical inefficiency of sorghum producer farmers. In many empirical studies, it is hypothesized that the distance between the plot and home decreases the level of efficiency of farmers. In this study, the coefficient of the plot distance is found to be statistically significant at a 5 percent significance level and negatively affects the technical efficiency of a farmer. As the plot distant from home increases, so as the technical efficiency decreases, whereas, technical inefficiency increases. This could be because the level of close supervision may not be so strong when the plots are far away from home.
Conclusion
The maximum likelihood estimated value of the stochastic frontier model indicated that out of six inputs, five inputs, land size, labor, oxen power, seed quantity, and fertilize were found to be statistically significant and positively affect sorghum productivity. The estimated mean technical efficiency of this study was 62.8%, with minimum, and maximum of 23.5% and 96.7 % respectively. The estimated gamma (γ) value of 73.4 % reveals the fact that a high level of technical inefficiency exists among the sampled farmers.
A large difference among farmers in their technical efficiency indicated that they are using their resources inefficiently and there exists a chance to improve their output using the current level of inputs and technology to scale up their efficiency. In the study area, there is a possibility to increase technical efficiency by 37.2% operating at full level of existing inputs and available technology. The estimated stochastic frontier inefficiency model result showed that education level, house hold size, farm experience, extension services, livestock size, credit access, and training significantly and positively affect technical efficiency of sorghum production. While, plot distance from home negatively influences the technical efficiency of sorghum production. The study result provides information to policymakers and extension workers on those input variables and inefficiency effects that determining the level of each farmer’s technical efficiency. The presence of higher inefficiency and the major factors that are responsible for the efficiency variation among the households have important policy implications to mitigate the farmers current inefficiency level in the study area. Farmers should improve the use of production inputs such as land allocated for sorghum, labor, oxen power, seed, and fertilizer that are statistically significant and have a positive contribution to increase sorghum production. The study result indicated that education has a positive and significant effect on sorghum producers' technical efficiency in the study area. Therefore, the concerned body should give emphasis to adult education to strength and establish the required facilities. Livestock holdings which have positively and significantly affected technical efficiency. Households having large livestock sizes can have a better opportunity to get more oxen draught power, sell livestock to earn money for input purchases like fertilizer, and serves for organic fertilizer formation. Therefore, providing improved veterinary treatments, water supplies, and fodder need to be encouraged. A positive and significant effect of the credit access on technical efficiency indicates that money obtained from credit services helps for purchasing agricultural inputs that they cannot afford from their own resources. Therefore, the concerned body should establish and expand the service rendered by credit providing institutions like micro finances in the study area. The study results suggested that the effect of extension service on the technical efficiency of sorghum production was statistically significant. Thus, extension services should be properly provided for sorghum producer farmers. The result of this study revealed also that farmers training have a positive effect on technical inefficiency. Thus, better training facilities should be adequately established and strengthen farmers training to improve sorghum productivity in the study area.
Ethics Approval and Consent to Participate
Not applicable
Consent for Publication
Not applicable
Competing Interests
Authors declare that they have no competing interests.
Authors Contributions
Both authors contributed substantial input into the manuscript. KC initiated the research idea, led the study design, data collection, manipulation, and analysis and manuscript preparation. TM provides indispensable input mainly in data management, analysis, and interpretation.
Acknowledgements
Not applicable
References
- Abate TM, Dessie AB, Mekie TM (2019). Technical efficiency of smallholder farmers in red pepper production in North Gondar zone Amhara regional state, Ethiopia. J Econ Struct. 8(1):1-18.
- Asfaw S, Shiferaw BA (2010). Agricultural technology adoption and rural poverty: Application of an endogenous switching regression for selected East African Countries. African Association of Agricultural Economists (AAAE). AEASA 48th Conference, September 19-23. Cape Town, South Africa.
- Baruwa O, Oke J (2012). Analysis of the Technical Efficiency of Small holder Cocoyam Farms in Ondo State, Nigeria. Tropicultura. 30(1):1-68.
- Battese GE, Coelli TJ (1995). A model for technical inefficiency effects in a stochastic frontier production function for panel data. Appl Econ. 20(2):325-332.
- Burke JJ, Chen J, Burow G, Mechref Y, Rosenow D, Payton P, Hayes CM (2013). Leaf dhurrin content is a quantitative measure of the level of pre‐and postflowering drought tolerance in sorghum. Crop Sci. 53(3):1056-1065.
- Coelli TJ (1995). Recent developments in frontier modelling and efficiency measurement. Aust J Agric Econ. 39(3):219-245.
- Coelli TJ, Rao DSP, O'Donnell CJ, Battese GE (2005). An introduction to efficiency and productivity analysis. 2nd edition. Springer science and business media, Berlin, Germany.
- Degefa K, Jaleta M, Legesse B (2017). Economic efficiency of smallholder farmers in maize production in Bako Tibe district, Ethiopia. Dev Ctry Stud. 7(2):80-86.
- Derese SA, Shimelis H, Laing M, Mengistu F (2018). The impact of drought on sorghum production, and farmer's varietal and trait preferences, in the north eastern Ethiopia: implications for breeding. Acta Agric Scand. B Soil Plant Sci. 68(5):424-436.
- Dessale M (2019). Analysis of technical efficiency of small holder wheat growing farmers of Jamma district, Ethiopia. Dessale Agric and Food Secur 8(1):1-8.
- Haile K, Haji J, Tegegne B (2019). Sources of Technical Inefficiency of Smallholder Farmers in Sorghum Production in Konso District, Southern Ethiopia. J Agric Educ Ext. 5(1):180-196.
- Hazarika C, Subramanian S (1999). Technical efficiency of government supported horticultural crops in Oman. Ind J Agri Eco. 54(2):201-210.
- Kibret SA, Singh S, Brar J (2016). Measurement of Technical Efficiency of Resettled Farm Households in Western Ethiopia. J Eco Financ. 7(6):54-62.
- Kinfe H, Tesfaye A (2018). Yield performance and adoption of released sorghum varieties in Ethiopia. Edelweiss Appl Sci Technol. 2(1):46-55.
- Meeusen W, Broeck VDJ (1977). Efficiency estimation from Cobb-Douglas production functions with composed error. Int Econ Rev. 18(2):435-444.
- Mohammed Z (2018). Comparative Technical Efficiency of Teff Production in Row Planting and Broadcasting Methods, Ethioopia. J Agric Appl Econ. 1(1):8-14.
- Shrestha CM (1992). Productivity and Technological Change in Nepalese Agriculture, 1965. Indian J Agric Econ. 47(902):114-116.
- Sibiko K, Owuor G, Birachi E, Gido E, Ayuya O, Mwangi J (2013). Analysis of determinants of productivity and technical efficiency among smallholder common bean farmers in eastern Uganda. J Econ Theory. 5(3):44-55.
- Son TVH, Coelli T, Fleming E (1993). Analysis of the technical efficiency of state rubber farms in Vietnam. Agric Econ. 9(3):183-201.
- Tekalign F (2019). Determinants of Technical Efficiency of Maize Production in Ethiopia: An Empirical Review. Environ Resour Econ. 4(4):144-151.
- Torkamani J, Hardaker JB (1996). A study of economic efficiency of Iranian farmers in Ramjerd district: An application of stochastic programming. Agric Econ. 14(2):73-83.
- Yemane T (1967). Statistics: An Introductory Analysis. 2nd edition. Harper and Row. New York, USA.