Research Article - (2022) Volume 10, Issue 1
Growth associated molecular markers and assessment of relatedness among four domestic quail genotypes in Egypt
Gomaa Said Ramadan1, Esteftah Mohamed El-Komy1, Reda El-wany. Moghaieb3, Farid Kamal Ramzi Stino2 and Mona Mohamed Ghaly2*2Department of Animal Production, Cairo University, Giza, Egypt
3Department of Genetics, Cairo University, Giza, Egypt
Received: 13-Jan-2022, Manuscript No. AASTGB-22-41646; Editor assigned: 17-Jan-2022, Pre QC No. AASTGB-22-41646 (PQ); Reviewed: 01-Feb-2022, QC No. AASTGB-22-41646; Revised: 08-Feb-2022, Manuscript No. AASTGB-22-41646; Published: 18-Feb-2022, DOI: 10.51268/2736-1810-22.10.054
Abstract
The DNA polymorphisms by microsatellites technique was applied to four genotypes of Japanese quail; Stino, White, Golden, and Japanese quail. The Stino quail had significantly the highest body weight at all ages followed by the White quail. The live body weight of both the Golden and Brown quail showed lower reciprocity order attitude across ages. The weight gain and growth rate of Stino and White quail were significantly the highest at almost periods. The mean number of alleles per locus (Na), effective allele (Ne), expected heterozygosity (He), Shannon's Information index (I) scored lower values for both Stino and the White quail (3.89, 2.97, 0.72, and 1.17), than the Golden and Brown quail. Stino quail had a higher Polymorphic information content value (0.81) than the White one (0.79) and they both scored lower values than the Golden and Brown quail (0.84 and 0.82), respectively. All genotypes were not under Hardy Wein-Berg equilibrium. Identity and genetic distance matrix had scores of 0.9267 and 0.0761 between the Stino and White quail, while 0.9275 and 0.0752 for the Golden and Brown quail, respectively. The phenotypic and molecular Neighbor joining procedures aggregated Stino and White quail in one cluster, Golden and Brown quail had joined in a different cluster. Unique microsatellite alleles were detected and recommended as marker aid selection in the Stino quail population as GUJ052, GUJ087 markers with live body weight at 21 day and GUJ054 for live body weight at 28 day. The GUJ059 is for carcass weight. Crossing between Golden and Japanese quail will have no benefit and is not recommended.
Keywords
Quail, Microsatellite markers, Growth parameters, Genetic variability, Marker aided selection.
Introduction
Japanese quail is useful for genetic studies due to its early sexual maturity, short generation interval, low feed consumption, quicker rate of growth and its smaller body size (Devi KS et al., 2010; Jatoi AS et al., 2013). Live body weight stands out among the most noteworthy traits since its general straight forwardness of estimation as well as for its direct relationship with other profitable meat production traits. Furthermore, it is known to be an intermediately heritable trait. This way, the choice of heavier individuals should result in the genetic improvement of the trait (Oke UK et al., 2004).
Three breeds of quail, Jidori, Shoukoku, and Oh-Shamo, (Oana H, 1951) were the original of most of today’s Japanese quail genotypes. Microsatellite DNA markers have an abundancy and codominant inheritance (Goldstein DB et al., 1997; Petit E et al., 1997). Genetic diversity is considered from the polymorphism of morphology, chromosome, blood protein and DNA. Microsatellite DNA markers are useful for kinship and paternity (Queller DC et al., 1993), genetic relationships among chickens, (Emara MG et al., 2002; Pandey AK et al., 2002; Zhang X et al., 2002; Zhang X et al., 2002) and for quail (Osman SA et al., 2004; Osman SM et al., 2005; Osman SA et al., 2006). Genetic mapping and linkage with quantitative traits (Tuiskula-Haavisto M et al., 2002), certain genes (McElroy JP et al., 2006) and identities among populations (Ya-Bo Y et al., 2006).
Recently, hundreds of microsatellite markers were developed for Japanese quail (Kayang BB et al., 2002; 19. Kayang BB et al., 2004). They used it to establish a linkage map (Kayang BB et al., 2004). Its polymorphism can clarify the phenotypic contrasts. Relations between molecular DNA markers and the quantitative trait loci had been stated by (Groenen MA et al., 2000; Yonash N et al., 2001), in broilers (Hardiman JW et al., 2010) and for chicken’s genome (Gholizadeh M et al., 2007). The microsatellites linkage map in quail was studied (Kayang BB et al., 2004; Miwa M et al., 2005). The genetic diversity of populations and the evolutionary relationship in quail were previously studied (Amirinia C et al., 2007; Bai JY et al., 2013; Chang GB et al., 2007; Farrag S.A et al., 2011; Emrani H et al., 2011; Kim SH et al., 2007; Chazara O et al., 2010; Mukesh T et al., 2011; Rashid MA et al., 2020; Fathi M et al., 2018; Roh H et al., 2021).
The present study was conducted to distinguish between the growth performance capabilities of four Japanese quail populations through molecular application of nine particular microsatellite DNA markers. In addition, to find specific markers associated with growth traits and loci responsible for quail’s meat production.
Materials and Methods
Genetic background
This experiment was carried out in 2019 for a six-month period at the Stino Quail Farm, Al-Hoda cooperative association, Cairo-Alexandria desert highway, 64 km, Egypt and the Poultry Experiment Station, Department of Animal Production, Faculty of Agriculture, Cairo University, Giza. The molecular analysis was carried out at both the Molecular Biology Laboratory of the Genetic Engineering Research Center, Faculty of Agriculture, Cairo University, Giza, Egypt and the Animal Production Biotechnology Lab, Central Laboratory Network, National Research Centre, Dokky, Giza.
Four lines of quail were used. Stino Quail, a selected line that is genetically improved for its higher body weight, white feathers and skin color by Prof. Farid Stino. He developed this Stino quail line from the Japanese quail line of Prof. Henery Marks (Tallahasse, FL) since 1971 (Marks HL, 1971). Dr. Stino started selecting this quail line since 1974 for its heavier 30-day old body weight. The original imported flock weighted about 150 gm at 4 weeks of age. The selection continued for 46 generations and it is still going on. About 25 generations ago, a recessive white mutation appeared in the population that was kept as a closed population since Dr. Stino had gotten it from the United States. This mutation affected the feather, skin and shank colors. The quail were almost completely white, with few brown feather patches. It also affected the color of the skin of the quail (white) and their shanks (white) instead of the slat color of the skin of the original Japanese population. This mutation was also associated with a slightly lower body weight than the original brown (Agoti) wild type. However, with the continuous phenotypic selection, the 46th generation of the Stino white quail weighs about 330 gm at 4 weeks of age. This weight is larger than any of the other commercial Japanese flocks worldwide.
The White quail line is a hybrid between males of Stino quail and a non-selected white line females. The Golden quail and the Brown quail (wild type) lines are two plumage-colors of the Japanese quail lines available at the Poultry Experiment Station of the Faculty of Agriculture, Cairo University.
Economic traits studied
1. Individual live body weight was measured to the nearest gram by a digital scale at hatch, 1, 2, 3, 4, and 5 weeks of age (Birds were fasted for 8 hours before weighing).
2. Body weight gain was calculated as BWG=W2-W1, where both W2 and W1 represented the final and initial weight, respectively.
3. The Growth rate was calculated using the following formula (Brody S et al., 1946).
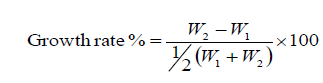
Where W1=first weight; W2=second weight.
Slaughter performance traits
Slaughter traits were obtained at 5 weeks of age. A random sample of 30 birds from each line was chosen. Birds were weighed (LBW) and slaughtered after 8 hours of fasting (Papa CM et al., 1991). Birds were slaughtered by slitting the throat, cutting the carotid arteries, jugular veins, esophagus and trachea without severing the head (Sams A et al., 2001). After slaughtering each bird was hanged in a bleeding funnel for 3 minutes and weighed again to obtain the blood weight. Birds were then scalded in a 66°C water bath for 20 seconds, and then the feathers were removed by an automatic circular feather plucker. The birds were then weighed again to get the feathers weight. The shanks and head, without the neck, were then removed and the birds where eviscerated and chilled. Each empty chilled carcass was weighted to obtain the dressed weight. Dressing percentages were expressed as the percentage of dressed weight relative to live body weight. Edible organs such as the liver, heart, and gizzard were also weighed and calculated relative to carcass live body weights.
Statistical analysis
The least square means ± SE were generated by the general linear model using the x-stat, 2014 software for the statistical analysis of the phenotypic traits. The separation of means was done according Duncan's multiple range test (Duncan DB, 1955) at a 5% significance level when differences between means exist. The following one-way ANOVA model was used:
Yij=μ+Gi+eij
Where:
Yij=the observed value of the ijth observation.
μ=the overall mean.
Gi=the effect of the ith genotype
ejj=Random error.
The phenotypic data for the four quail genotypes was clustered by clustering procedures used to calculate the nearest neighbor hierarchical method by SAS 9.4.
Blood DNA isolation
The random individual blood samples of 120 birds (30 per genotype) via heart puncture were collected at 30 days of age in coagulate buffer (0.20 ml blood per sample) in a treated tube of K3-EDTA (FL medical, Italy) and stored at 5°C until DNA extraction. A PureLink Genomic DNA Mini; Microcentrifuge spin-column format (Invitrogen™ K182001, USA) was applied in order to obtain a pure extracted DNA. A NanoDrop® ND-1000 UV-Vis Spectrophotometer procedure was used to examine the product (pure DNA) for purity.
Microsatellite markers statistics
Nine, of fifteen tested, microsatellite DNA markers (Table 1) were used. PCR reactions were performed in a final volume of 50 μl reaction mixture, composed of 3 μl DNA (40 ng/μl), 45 μl of PCR SuperMix 1.1 × concentration (Invetrogen, USA), 1.5 μl of each primer (10 pmol/μl). The amplification conditions, on a Genemate B960 gradient thermal cycling platform, were as follows: Initial denaturation step at 94°C for 3 mins, 30 cycles of amplification (45s of denaturation at 94°C, 60s of annealing at 55°C,56°C or 60°C based on the optimal annealing temperature for the used primer, 60s of extension at 72°C), and this was followed by a final extension at 72°C for 12 min. PCR products were electrophoresed on 1.5% agarose gel containing 0.5% ethidium bromide then viewed under UV light, and documented using Uvp-BioDoc system.
| Locus | GenBank ANa | Repeat array | F/R | Primer sequence (5´-3´) | Size rang (bp) | TAb (°C) |
|---|---|---|---|---|---|---|
| GUJ054 | AB063122 | (CA)7 | F | GTGTTCTCTCACTCCCCAAT | 120-146 | 55 |
| R | ATGTGAGCAATTGGGACTG | |||||
| GUJ059 | AB063127 | (CA)10 | F | GACAAAGTTACAGCTAGGAG | 207-219 | 50 |
| R | TAGGTGCGAAAATCTCTGAC | |||||
| GUJ052 | AB063120 | (CA)12 | F | AAACTACCGATGTAAGTAAG | 96-108 | 55 |
| R | ATGAGATATATAAGGAACCC | |||||
| GUJ063 | AB063131 | (CA)7CT(CA)2CT(CA)7 | F | GCTCAGGTTCTCAGCTGATG | 242-250 | 55 |
| R | GGGAGAGATCAAGGGAACAG | |||||
| GUJ087 | AB063155 | (CT)12AA(CA)11 | F | CATGCCGGCTGCTATGACAG | 151-155 | 55 |
| R | AAGTGCAGGGAGCGAGGAAG | |||||
| GUJ085 | AB063153 | (GT)14 | F | ACAACCACTTCTCCAGCTAC | 245-265 | 55 |
| R | GCTTGTGCTGCTGTTGCTAA | |||||
| GUJ071 | AB063139 | (CA)8 | F | AGATCCTGCTCCTGGAATTG | 160-178 | 54 |
| R | CAGCTGCACTTAATACAGGC | |||||
| GUJ010 | AB035820 | (CA)15 | F | TTCCTTCTGGGTGCTGCTCA | 154-158 | 62 |
| R | CATAGACACATCCCTCCCTC | |||||
| GUJ049 | AB035859 | (CA)11 | F | GAAGCAGTGACAGCAGAATG | 229-241 | 55 |
| R | CGGTAGCATTTCTGACTCCA |
Note: The locus code GUJ stands for Gifu University Japanese quaila GenBank AN: GenBank accession number; bTA: Temperature of annealing. The information provided for GUJ010 and GUJ049 by Kayang B.B. et al., and Others by Kayang B.B. et al.
Genotyping statistical analysis
The size of the alleles was estimated through comparison a with standard ladder DNA marker. Each allele size was estimated according to its repeated number for each microsatellite marker. The frequencies of different alleles were estimated in different genotype groups following gene-counting method by Nei index genetic diversity (Nei M, 1978). The input files for all genetic software using Convert version 1.3.1 (Glaubitz JC, 2004). POPGENE 3.2 software package, (Yeh FC, 1999) were used to calculate heterozygosity (H). The polymorphism information content (PIC) was calculated according to (Botstein D et al., 1980) by using CERVUS version 3 software (Kalinowski ST et al., 2007). The pair-wise alleles sharing were calculated manually from the row results. The Data in Table 1 summarizes effective microsatellite information as loci, accession numbers, flanking sequences, annealing temperatures and corresponding references.
Phylogenetic tree construction
A phylogenetic tree, from pairwise genome alignments, was constructed. The Sysat 7.0 software was used to draw the dendrogram presentations. The molecular phylogenic tree (unweighted pair group method with an arithmetic mean (UPGMA)) analysis was performed to establish phylogenetic dendrogram using 100 bootstrap replicates. The rooted tree was then constructed using the Neighbor-Joining method.
Results
Growth performance
The quail growth performance that is presented in Table 2 revealed that the least square means of live body weights from hatch (BW0) up to the end of fifth's weeks of age (BW5) were significantly (P˂0.05) the highest body weight was that of Stino quail and the lowest was that of the brown quail. Stino quail had also significantly (P˂0.05) the higher body weight gain during all intervals. The Brown Japanese quail had significantly (P˂0.05) the lowest weight gain of all genotypes during most of the periods. At the same time, the Golden Japanese quail (P˂0.05) also had significantly lower body weight gain of all genotypes during late ages.
The carcass weight of Stino quail was significantly (P˂0.05) the highest (250 gm) vs. 208, 180 and 151 gm for the White, Golden and Brown quail, respectively. The same trend was also observed for the for liver, heart and giblet weights, where Stino quail had a significantly (P˂0.05) higher weight than the other genotypes, as shown in Table 2.
| Live body weight | ||||
|---|---|---|---|---|
| Period | Stino quail | White quail | Golden quail | Brown quail |
| Hatch | 12a ± 0.12 | 11b ± 0.12 | 9c ± 0.12 | 9c ± 0.12 |
| 7-Day | 42a ± 0.63 | 30c ± 0.63 | 33b ± 0.63 | 23d ± 0.63 |
| 14-Day | 95a ± 1.67 | 77b ± 1.67 | 60c ± 1.67 | 41d ± 1.67 |
| 21-Day | 192a ± 2.41 | 146b ± 2.41 | 103c ± 2.41 | 102c ± 2.41 |
| 28-Day | 282a ± 2.22 | 249b ± 2.22 | 161d ± 2.22 | 171c ± 2.22 |
| 35-Day | 385a ± 2.96 | 274b ± 2.96 | 209c ± 2.96 | 156d ± 2.96 |
| Body weight gain | ||||
| 0:14 Day | 82.7a ± 1.66 | 66.1b ± 1.66 | 50.72c ± 1.66 | 31.19d ± 1.66 |
| 0:21 Day | 179.9a ± 2.39 | 134.9b ± 2.39 | 92.97c ± 2.39 | 91.84c ± 2.39 |
| 0:35 Day | 336.6a ± 2.70 | 262.8b ± 2.70 | 207.70c ± 2.70 | 199.25c ± 2.70 |
| 21:35 Day | 156.7a ± 3.38 | 127.9b ± 3.38 | 106.28d ± 3.38 | 115.85c ± 3.38 |
| 28:35 Day | 69.6a ± 3.38 | 24.2c ± 3.38 | 48.18b ± 3.38 | 46.12b ± 3.38 |
| Growth rate | ||||
| 0:14 Day | 152.9a ± 2.14 | 147.9b ± 2.14 | 144b ± 2.14 | 109.9c ± 2.14 |
| 0:21 Day | 176.1a ± 0.65 | 169.3b ± 0.65 | 164.8c ± 0.65 | 164.9c ± 0.65 |
| 0:35 Day | 186.6a ± 0.22 | 184.0b ± 0.22 | 181.9d ± 0.22 | 182.8c ± 0.22 |
| 21:35 Day | 58.2b ± 1.77 | 62.9b ± 1.77 | 67.8a ± 1.77 | 72.3a ± 1.77 |
| 28:35 Day | 5.8a ± 1.77 | 2.3b ± 1.77 | 6.6a ± 1.77 | 5.8a ± 1.77 |
| Edible inner organs | ||||
| Organ | Stino quail | White quail | Golden quail | Brown quail |
| Carcass | 250a ± 1.83 | 208b ± 1.83 | 180c ± 1.83 | 151d ± 1.83 |
| Liver | 9.8a ± 0.11 | 7.4b ± 0.111 | 5.5c ± 0.11 | 5.7c ± 0.11 |
| Gizzard | 4.1c ± 1.42 | 5.9a ± 1.42 | 3.1d ± 1.42 | 4.5b ± 1.42 |
| Heart | 5.8a ± 0.33 | 3.6b ± 0.333 | 1.1d ± 0.33 | 2.2c ± 0.33 |
| Giblet | 19.7a ± 0.41 | 16.9b ± 0.412 | 9.9d ± 0.41 | 12.7c ± 0.41 |
| Probability | 0.0001 | 0.0001 | 0.0001 | 0.0001 |
| Edible inner organs % | ||||
| Carcass | 72c ± 1.01 | 77b ± 1.01 | 87a ± 1.01 | 70c ± 1.01 |
| Liver | 2.8a ± 0.05 | 2.8a,b ± 0.05 | 2.7b ± 0.05 | 2.7b ± 0.05 |
| Gizzard | 1.2c ± 0.48 | 2.2a ± 0.48 | 1.7b ± 0.48 | 2.2a ± 0.48 |
| Heart | 1.7a ± 1.10 | 1.3b ± 1.10 | 0.5d ± 1.10 | 0.9c ± 1.10 |
| Giblet | 5.8b ± 1.35 | 6.9a ± 1.35 | 4.9c ± 1.35 | 5.8b ± 1.35 |
Note: a,b,cValues within rows between quail lines followed by different superscript, different (P˂0.05).
Genotypes allocation to clusters and cluster distance
As shown in Figure 1, phylogenetic tree for the phenotypic data aggregated the four quail genotype populations by the nearest neighbor method in three distinct clusters. The first one aggregates the golden and brown quail populations, they seem to be the most homologous groups. Their inter cluster distance was the lowest of all clusters (0.5348). The second cluster compresses Stino and its hybrid at 0.7422 distance points. Finally, the third clusters distance was obtained by the nearest-neighbor method for the four genotype populations was (1.1361).
Microsatellite profile
The data of the nine microsatellites that was analyzed is presented in Table 3. The average number of alleles were 3.89, 4.56, and 4.67 for Stino quail, White quail, Golden and Brown quail, respectively. Stino and White quail had a lower average number of effective alleles (2.97) compared to 3.42, and 3.48 for the Golden and Brown quail. The mean observed heterozygosity was 0.53, 0.56, 0.57, and 0.60 for Stino, White, Golden and Brown quail, respectively. The expected heterozygosity for Stino and White quail recoded the lowest (0.72) vs. 0.78 and 0.79 for the Golden and Brown quail populations, respectively. The average heterozygosity was the lowest for Stino quail (0.61) on the contrary, they were 0.65, 0.70, and 0.82 for White, Golden and Brown quail groups. Both Stino and white quail had a Nui score of 0.62 which was lower than 0.70 and 0.82 for the Golden and Brown quail. The fixation index values (I) followed the same trend for Stino and White quail 1.17 vs. 1.34 and 1.36 for Golden and Brown quail, respectively. The polymorphic information content was higher for Stino quail (0.81) as compared to the white cross (0.79). At the same time, they were still lower than the Golden and Brown quail, 0.84 and 0.82, respectively.
| Stino quail population | |||||||
|---|---|---|---|---|---|---|---|
| Locus | Na | Ne | Ho | He | Ave-Het | PIC | I |
| GUJ054 | 4 | 2.94 | 0.6 | 0.73 | 0.6 | 0.77 | 1.19 |
| GUJ059 | 4 | 2.94 | 0.6 | 0.73 | 0.6 | 0.84 | 1.19 |
| GUJ052 | 4 | 2.94 | 0.6 | 0.73 | 0.6 | 0.84 | 1.19 |
| GUJ063 | 4 | 2.94 | 0.6 | 0.73 | 0.6 | 0.84 | 1.19 |
| GUJ087 | 4 | 2.94 | 0.6 | 0.73 | 0.6 | 0.82 | 1.19 |
| GUJ085 | 6 | 4.51 | 0.6 | 0.87 | 0.78 | 0.84 | 1.64 |
| GUJ071 | 3 | 2.38 | 0.4 | 0.64 | 0.58 | 0.82 | 0.94 |
| GUJ010 | 3 | 2.17 | 0.4 | 0.6 | 0.45 | 0.79 | 0.89 |
| GUJ049 | 3 | 2.94 | 0.4 | 0.73 | 0.66 | 0.77 | 1.088 |
| Mean ± SE | 3.890.93 | 2.97±0.65 | 0.53 ± 0.10 | 0.72±0.07 | 0.61±0.09 | 0.81±0.03 | 1.17±0.21 |
| White quail population | |||||||
| GUJ054 | 4 | 2.94 | 0.6 | 0.73 | 0.66 | 0.77 | 1.19 |
| GUJ059 | 4 | 2.94 | 0.6 | 0.73 | 0.66 | 0.84 | 1.19 |
| GUJ052 | 4 | 2.94 | 0.6 | 0.73 | 0.66 | 0.84 | 1.19 |
| GUJ063 | 4 | 2.94 | 0.6 | 0.73 | 0.66 | 0.84 | 1.19 |
| GUJ087 | 4 | 3.57 | 0.6 | 0.73 | 0.66 | 0.77 | 1.19 |
| GUJ085 | 4 | 3.57 | 0.6 | 0.8 | 0.72 | 0.79 | 1.41 |
| GUJ071 | 4 | 2.77 | 0.6 | 0.71 | 0.64 | 0.82 | 1.17 |
| GUJ010 | 3 | 2.17 | 0.4 | 0.6 | 0.54 | 0.79 | 0.89 |
| GUJ049 | 3 | 2.94 | 0.4 | 0.73 | 0.66 | 0.77 | 1.09 |
| Mean ± SE | 3.89 ± 0.60 | 2.97±0.419 | 0.56 ± 0.09 | 0.72 ±0.05 | 0.65±0.05 | 0.79±0.03 | 1.17±0.01 |
| Golden quail population | |||||||
| GUJ054 | 6 | 4.16 | 0.6 | 0.84 | 0.76 | 0.87 | 1.61 |
| GUJ059 | 4 | 2.94 | 0.6 | 0.73 | 0.66 | 0.84 | 1.19 |
| GUJ052 | 4 | 2.94 | 0.6 | 0.73 | 0.66 | 0.84 | 1.19 |
| GUJ063 | 4 | 2.94 | 0.6 | 0.73 | 0.66 | 0.82 | 1.19 |
| GUJ087 | 4 | 2.94 | 0.6 | 0.73 | 0.66 | 0.82 | 1.19 |
| GUJ085 | 5 | 3.57 | 0.6 | 0.8 | 0.72 | 0.84 | 1.41 |
| GUJ071 | 5 | 4.16 | 0.6 | 0.84 | 0.76 | 0.84 | 1.5 |
| GUJ010 | 4 | 3.33 | 0.4 | 0.8 | 0.7 | 0.82 | 1.28 |
| GUJ049 | 5 | 3.84 | 0.4 | 0.82 | 0.74 | 0.84 | 1.47 |
| Mean ± SE | 4.56 ± 0.73 | 3.42±0.53 | 0.57 ± 0.09 | 0.78 ±0.05 | 0.70±0.04 | 0.84±0.02 | 1.34±0.16 |
| Brown quail population | |||||||
| GUJ054 | 5 | 3.57 | 0.6 | 0.8 | 0.72 | 0.64 | 1.42 |
| GUJ059 | 4 | 2.94 | 0.6 | 0.73 | 0.66 | 0.88 | 1.19 |
| GUJ052 | 5 | 3.57 | 0.6 | 0.8 | 0.72 | 0.87 | 1.42 |
| GUJ063 | 4 | 2.94 | 0.6 | 0.73 | 0.66 | 0.82 | 1.19 |
| GUJ087 | 4 | 2.94 | 0.6 | 0.73 | 0.66 | 0.82 | 1.19 |
| GUJ085 | 5 | 3.84 | 0.8 | 0.82 | 0.74 | 0.87 | 1.47 |
| GUJ071 | 5 | 3.57 | 0.4 | 0.8 | 0.72 | 0.84 | 1.42 |
| GUJ010 | 5 | 4.1 | 0.6 | 0.84 | 0.76 | 0.82 | 1.5 |
| GUJ049 | 5 | 3.84 | 0.6 | 0.82 | 0.74 | 0.84 | 1.47 |
| Mean ± SE | 4.67±0.500 | 3.48 ± 0.44 | 0.60 ± 0.10 | 0.79 ±0.04 | 0.82±0.04 | 0.82±0.07 | 1.36±0.13 |
Note: Na=Number of different alleles; Ne=Effective number of alleles; Ho=Observed heterozygosity; He=Expected heterozygosity; Ave-Het=Average heterozygosity; PIC=Polymorphic information content; I=Shannon's Information index.
Genetic variation and breeds diversity
The genetic differentiation among different quail populations was analyzed by the molecular procedure based on the identity and distance matrix (Table 4). The closest genetic makeup was observed between Stino and its hybrid the White quail. They had an identity score of 0.9267 and a genetic distance of 0.0761. The same trend was observed between the Golden and Brown quail, where they had identity score of 0.9275 and genetic distance of 0.0752 (Nei M, 1978).
| Population | Stino quails | White quails | Golden quails | Brown quails |
|---|---|---|---|---|
| Stino Quails | **** | 0.9267 | 0 | 0 |
| White Quails | 0.0761 | **** | 0 | 0 |
| Golden Quails | 0 | 0 | **** | 0.9275 |
| Brown Quails | 0 | 0 | 0.0752 | **** |
Note: Genetic identity (above diagonal) and genetic distance (below diagonal).
Correlation with growth performance
Six of the studied Microsatellites had a significantly (P˂0.05) positive association with the live body weight and carcass traits. Their molecular weight ranged from 126-451 bp (Table 5). Four of them were correlated with Stino quail growth at specific ages. The GUJ052 and GUJ087 microsatellites had a high correlation coefficient of 0.7620 with a body weight at 21-days of age. The live body weight at 28-days of age was correlated (0.6984) with locus GUJ054. A correlation coefficient of 0.6944 between GUJ059 marker and carcass weight was also observed. One allele, GUJ085 was highly correlated with live body weight at 21 days of age (0.810) of the golden quail population. Finally, GUJ010 and GUJ087 were highly correlated with hatch weight in brown quail with a correlation coefficient of 0.8018 and 0.6547, respectively. However, the negative correlations were observed between the allelic numbers for the GUJ049, GUJ052, GUJ063, GUJ071, GUJ085, GUJ087 markers and most studied traits were significant (P˂0.05).
| Stino quail | ||||||||||||
|---|---|---|---|---|---|---|---|---|---|---|---|---|
| Locus | Alleles | Alleles size (bp) | Hatch | 7-days | 14-days | 21-days | 28-days | 35-days | Carcass | Liver | Heart | Gizzard |
| GUJ054 | 1 | 126 | 0.2217 | -0.0437 | 0.0437 | -0.0437 | 0.6984 | -0.3492 | 0 | 0.5388 | -0.133 | -0.4658 |
| GUJ059 | 1 | 176 | 0.387 | 0.5715 | -0.3429 | 0 | 0.5715 | 0.0381 | 0.6944 | 0.5487 | 0 | 0.0813 |
| GUJ052 | 1 | 140 | -0.2322 | -0.4572 | 0.3048 | 0.762 | 0.2667 | -0.0762 | -0.7329 | 0.2744 | 0.0387 | -0.4066 |
| GUJ063 | 1 | 223 | -0.1548 | 0.5715 | 0.0762 | 0.3048 | 0.0762 | 0.2286 | -0.0772 | 0 | -0.4644 | 0.0813 |
| GUJ087 | 1 | 159 | -0.2322 | -0.4572 | 0.3048 | 0.762 | 0.2667 | -0.0762 | -0.7329 | 0.2744 | 0.0387 | -0.4066 |
| GUJ085 | 1 | 238 | -0.1548 | -0.3048 | -0.6858 | -0.1524 | 0.2667 | -0.1143 | 0.1157 | 0 | 0.2709 | -0.1627 |
| GUJ071 | 2 | 149, 116 | -0.0362 | -0.0356 | 0.1426 | 0.0356 | 0.0713 | -0.1782 | 0.2887 | 0.33 | 0.5068 | -0.2282 |
| GUJ010 | 2 | 130, 351 | 0.0362 | 0.0356 | -0.1426 | -0.0356 | -0.0713 | 0.1782 | -0.2887 | -0.33 | -0.5068 | 0.2282 |
| GUJ049 | 1 | 264 | -0.0387 | -0.2667 | 0.3048 | -0.2667 | 0.3048 | -0.3429 | -0.1157 | 0.3527 | 0.0774 | 0.1627 |
| White quail | ||||||||||||
| GUJ054 | 1 | 126 | -0.0904 | -0.1356 | -0.2619 | -0.3065 | -0.2627 | 0.0439 | -0.1347 | -0.0443 | -0.1768 | 0.3273 |
| GUJ059 | 1 | 176 | -0.0904 | -0.1356 | 0 | 0 | -0.3503 | 0.1318 | -0.3592 | 0.1773 | 0 | -0.3273 |
| GUJ052 | 1 | 140 | -0.0904 | 0 | -0.1746 | 0.4816 | 0.3503 | 0.3514 | 0.5837 | 0.532 | -0.1768 | 0.3273 |
| GUJ063 | 1 | 223 | 0.4218 | 0.3616 | 0 | -0.2919 | -0.3503 | 0.527 | -0.2395 | 0.1773 | -0.4714 | -0.2182 |
| GUJ087 | 1 | 159 | -0.1183 | -0.355 | -0.2667 | -0.1529 | 0.1147 | 0.1533 | -0.8231 | -0.8126 | -0.1543 | -0.0476 |
| GUJ085 | 1 | 238 | 0.4519 | -0.4067 | -0.6111 | -0.7006 | -0.3503 | 0.1757 | -0.1347 | 0.0887 | 0.3536 | 0.3273 |
| GUJ071 | 1 | 149 | -0.3616 | 0 | 0.6111 | 0.3941 | -0.2189 | 0.0878 | -0.5388 | -0.2217 | -0.5303 | -0.2182 |
| GUJ010 | 2 | 130, 351 | 0.1183 | -0.2367 | -0.0381 | 0.344 | 0.3058 | 0.0383 | 0.0392 | 0.0387 | 0 | -0.5238 |
| GUJ049 | 1 | 264 | -0.4218 | 0.3616 | 0.1746 | 0.1168 | -0.0584 | -0.0586 | 0.2395 | 0.3547 | -0.2357 | 0.2182 |
| Golden quail | ||||||||||||
| GUJ054 | 1 | 131 | -0.374 | -0.4054 | -0.1318 | 0 | -0.0439 | -0.0901 | -0.3113 | -0.1402 | -0.0445 | -0.1808 |
| GUJ059 | 5 | 208,198, 140,150, 169 | -0.0467 | -0.4054 | 0 | 0.3094 | 0.527 | -0.3604 | 0.0889 | 0.187 | 0.4892 | -0.0452 |
| GUJ052 | 1 | 115 | -0.2337 | -0.2703 | -0.6588 | -0.1768 | -0.0439 | 0.1802 | -0.3113 | -0.1402 | -0.0445 | -0.1808 |
| GUJ063 | 1 | 248 | 0.1145 | 0.0368 | 0.5021 | 0.5774 | 0.2152 | -0.7356 | 0.1816 | 0.0763 | 0.1089 | -0.2214 |
| GUJ087 | 1 | 96 | 0 | 0.1966 | 0.3834 | 0.27 | 0.115 | 0.1966 | -0.0388 | -0.2856 | -0.3494 | -0.0789 |
| GUJ085 | 1 | 238 | -0.1224 | -0.1966 | 0.3067 | 0.8101 | 0.5367 | -0.7078 | 0.2329 | 0.2856 | 0.1941 | -0.1578 |
| GUJ071 | 1 | 270 | 0.0935 | 0.1351 | 0.4392 | 0.4419 | 0.1757 | -0.3153 | 0.0445 | -0.1402 | -0.2668 | -0.6779 |
| GUJ010 | 2 | 140, 451 | 0.408 | 0.4718 | 0.115 | -0.3086 | -0.3067 | -0.1573 | 0.1165 | 0 | 0.2717 | 0.2761 |
| GUJ049 | 2 | 257, 333 | -0.1632 | -0.0393 | 0.115 | -0.4243 | -0.3834 | 0 | 0.2717 | -0.2856 | -0.5435 | -0.5128 |
| Brown quail | ||||||||||||
| GUJ054 | 1 | 131 | -0.2182 | -0.1044 | 0.5937 | 0.0348 | -0.2437 | 0.4904 | 0.2811 | 0.4472 | -0.0354 | 0.4568 |
| GUJ059 | 4 | 133,119,104,90 | -0.0891 | 0.3553 | 0.5346 | -0.1421 | 0.1421 | -0.143 | 0.1793 | 0 | 0.433 | -0.4662 |
| GUJ052 | 1 | 115 | 0.0891 | -0.0711 | 0 | 0.0711 | -0.2132 | -0.572 | -0.6096 | 0 | -0.1083 | -0.7172 |
| GUJ063 | 3 | 248, 387, 547 | -0.8018 | 0.3553 | 0.3208 | 0.2843 | -0.2132 | -0.1788 | -0.2869 | 0 | -0.2165 | 0.5021 |
| GUJ087 | 1 | 96 | 0.6547 | -0.0348 | -0.1397 | -0.5919 | 0.3133 | 0.1051 | 0.246 | 0 | 0.4596 | -0.773 |
| GUJ085 | 1 | 238 | -0.3273 | 0.5222 | 0.3056 | 0 | 0 | -0.1751 | -0.4392 | 0 | 0.0884 | -0.1318 |
| GUJ071 | 1 | 270 | 0.3563 | 0.2843 | -0.0356 | -0.4264 | 0.3553 | 0 | 0.1793 | 0 | 0.5052 | -0.6455 |
| GUJ010 | 2 | 142, 451 | 0.8018 | -0.3553 | -0.3208 | -0.2843 | 0.2132 | 0.1788 | 0.2869 | 0 | 0.2165 | -0.5021 |
| GUJ049 | 3 | 115,227, 33 | 0.3273 | -0.1741 | -0.6984 | 0.087 | -0.2611 | -0.5254 | -0.571 | 0 | -0.3536 | -0.7027 |
Note: **Values in bold are different from 0 with a significance level alpha=0.05.
Genome wide phylogenies
Phylogenies using the neighbor joining procedure, using genetic distance DA were constructed as shown in Figure 2. The multiple alignments of concatenated nine allele loci aggregated the Stino and white quail closely, in one cluster, whereas golden and brown quails had joined in a different closely cluster branch. Both were supported by 100% bootstrap confidence (Nei M, 1978).
Discussion
Growth performance
The phenotypic data for growth performance (Table 2) revealed that the least square means of live body weight from hatch (BW0) up to the end of fifth's weeks of age (BW5) was significantly (P˂0.05) higher for Stino quail followed by its hybred white one. Stino quail and its hybred white had significantly (P˂0.05) the highest two ranks of body weight gain during the four age intervals. The Brown quail significantly had (P˂0.05) the lowest weight gain (31 gm) of all genotypes during the early ages (0-14 days) compared to 83, 66 and 51 gm for Stino, White and Golden quail, respectively. Similarly, the Golden quail significantly (P˂0.05) had the lowest weight gain (106 gm) of all genotypes during its late ages, (21-35 d) compared to 157, 128 and 116 gm for Stino, White and Golden quail, respectively. Stino quail and its hybrid White quail significantly had (P˂0.05) the highest two ranks of growth rates during the three intervals (0-14, 0-21, 0-35). Stino quail significantly had (P˂0.05) a higher carcass weight than all the other groups (250 gm) vs. 208, 180 and 151 gm for White, Golden and Brown quail, respectively. The highest (P˂0.05) absolute liver weight, heart and giblet weights and percentage was that of the Stino quail (Table 2). This is due to their higher body weight as a result of their metabolic rate efficiency as a response to the successive 46 generations of selection for high 30-day live body weight.
Genotypes allocation to clusters and cluster distance
As shown in Figure 1, the phylogenetic tree for the phenotypic performance aggregated the four quail genotype populations by the nearest neighbor method in three distinct clusters. The first one aggregates the Golden and brown quail populations, they seem to be the most homologous groups. Their inter cluster distance was (0.5348). They represent two plumage-colors of Japanese quail; Golden quail has been thought to be derived from the Brown quail by simple mutation. The second cluster compresses Stino and White quail at a 0.7422 point of distance. The White quail is the hybrid of male Stino quail and a non-selected white female line. These findings are in consistent with these obtained by (Ugbo YS, 2010) who stated that similar genotypes possess the existence of a high gene flow. Finally, the third cluster distances obtained by the nearest-neighbor method aggregated the four genotype populations with a total distance of (1.1361).
Microsatellite profile
Summarized information is shown in Table 3 using the effective nine microsatellites for the four quail populations studied. The average number of alleles (Na) for all loci within each genotype was 3.89 for both Stino and white quail. However, they were 4.56 and 4.67 to the Golden and Brown quail, respectively. Stino and White quail had lower average number of (2.79) of effective alleles (Ne). The lower allelic number and effective alleles of Stino quail points out how they have a homogeneous aggregation for growth alleles as a result of consecutive selection for body higher body weight at 30-days of age. Consequently, White quail had received a copy of them owing to the additive heritable nature of growth traits (Oke UK et al., 2004). The higher allelic number, (3.42 and 3.48) for Golden and Brown quail is due to their heterogeneous genetic makeup. The observed (Ho) heterozygous confirm the previous in which where lower values were scored for Stino and White quail, 0.53, 0.56 as compared to Golden and Brown quail, 0.57 and 0.60, respectively. The average heterozygosity was the lowest for Stino quail (0.61), which had undergone selection for high live body weight at 30 days of age for 46 generations, compared to 0.65, 0.70, and 0.82 for the White, Golden and Brown quail. Heterozygosity reflects the degree of genetic variation within group (Bai JY et al., 2016; Hata A et al., 2020).
Other allelic statistics, Nui and fixation index (I) confirmed the previous finding in which both Stino and White quail observed a lower Nui score of 0.62, which is lower than 0.68 and 0.71 for the Golden and Brown quail. Fixation index was the same for Stino and White quail 1.17 vs. 1.34 and 1.36 for the Golden and Brown quail, respectively.
The polymorphic information content results reveal that all microsatellite alleles fragments are highly polymorphic due to the obtained PIC ˃ 0.5(Bai JY et al., 2016; Bai JY et al., 2018). For all quail populations Stino quail had scored a higher PIC value (0.81) than the White quail (0.79). This may be due to possessing different allelic copies (unique) than the White quail genotypes. This finding is similar to those stated by (Parmar SN; Ramadan GS et al., 2014; Ramadan GS et al., 2018; Vanhala T et al., 1998)in chicken. The selection for high body weight increases the number of alleles, some of them is responsible for high polymorphism. The same finding was obtained by (Bai JY et al., 2018, Daquan MQ et al., 2007) in quail. The higher values of PIC for Golden quail (0.81) and Brown quail (0.84) may reflect their heterozygosity. A higher value of expected heterozygosity was obtained in Stino and white quail (0.72) vs. 0.78 and 0.79 for the simplies that these populations are not under the Hardy-Weinberg equilibrium but under a disequilibrium case due to an external force. Stino quail is known to be undergoing selection for 46 generations as one of the disturbance forces.
The study of (Rahim A et al., 2017) stated a disequilibrium the Hardy-Weinberg state for all microsatellites used under selection force for egg production in chickens. The other quail populations may be under different disequilibrium factors. Disturbed or inappropriate random mating may not be only one of them but may also be the principle one. The different numbers of selected microsatellite DNA markers let the comparative of previous studies hard.
Genetic variation and diversity
Many studies have referenced the application of microsatellites for genetic identity and distance, (Delany ME 2003, Okumu ON et al., 2017) Our results were calculated from nine microsatellite among different quail populations analyzed by molecular variance (Table 4). Stino and White quail had an identity and genetic distance score of 0.9267 and 0.0761. This finding indicates that they possess a close genetic makeup between them which resulted from crossing Stino male quail once with a white female line four generations ago. The same trend was observed between the Golden and Brown quail. They scored 0.9275 and 0.0752 for identity and genetic distance, respectively. They are thought to have common ancestors, where the Golden quail has been derived from the Brown ones by a simple mutation. Crossing between golden and brown quail is not recommended because a very low heterosis benefit could be achieved.
Correlation with growth performance
The results presented in Table 5 indicated a significant (P˂0.05) association between specific microsatellites and the growth at specific ages for the Stino quail. The GUJ052 and GUJ087 microsatellites had a high correlation coefficient of 0.7620 with a body weight at 21 days of age. Live body weight at 28-days of age was significantly (P˂0.05) correlated (0.6984) with locus GUJ054. A significant (P˂0.05) correlation of 0.6944 was observed between GUJ059 marker and carcass weight as presented. (Ramadan GS et al., 2014; Ramadan GS et al., 2018; Uemoto Y et al., 2009) observed the existence of a positive correlation coefficients between DNA microsatellite markers, body weight, and other carcass characteristics.
Genome wide phylogenies
The phylogenies by neighbor joining procedure, using genetic distance DA had categorized various genetic populations into specific clusters and branches (Avise JC et al., 2004). The obtained relationships as shown in Figure 2, were obtained from the genetic study was in accordance with the results obtained through the phenotypic clusters tree described in Figure 1. The multiple alignments of concatenated nine allele loci had aggregated Stino and white quail closely in one cluster, where they are homologous groups. White quail is the hybrid of male Stino quail with a non-selected white females’ line. Stino and White quail had not been thought to be genetically close to Golden or Brown quail. Golden and Brown quail had joined in a different close cluster branch. Similar genotypes possess the existence of a high gene flow (Ugbo YS, 2010). Such relatedness reveals a possibility of having common ancestors. It has been thought that golden quail had been derived from Brown ones by a simple mutation. Crossing between Golden and Brown quail is not recommended because of the very low heterosis benefit for growth that could be achieved.

Figure 1. Phenotypic Dendrogram trees between four quail genotypes using the nearest neighbor hierarchical cluster method. Note: Number at the node indicates the average distance of a cluster.

Figure 2. Rooted neighbor-joining tree of four quail genotypes produced by UPGMA clustering based on Nei’s genetic distance using 9 micro-satellite loci. Note: The scale bar represents the DA genetic distance calculated according to Sysat 7.0 software. Bootstrap values are 100%.
Conclusion
The microsatellite DNA markers were successfully reliable in indicating a relation and variability among four quail populations. Specific markers had high positive correlations with body weight at 21 and 28-days of age and carcass weight for the Stino quail population. Therefore, these markers are recommended in a breeding program (Marker Aid Selection). It is not recommended to cross the Golden and the Brown quail to enhance growth between because of their high genetic identity score.
Declaration of Interest
The authors declare that they have no conflict of interest.
Acknowledgment
I would like to express my sincere gratitude and appreciation to prof., Ahmed El-sharkawy , who provides his Molecular Biology Labaratory of the Genetic Engineering Research Center, Faculty of Agriculture, Cairo University, Giza, Egypt for our molecular analysis.
REFERENCES
Devi KS, Gupta BR, Prakash MG, Qudratullah S, Reddy AR (2010). Genetic studies on growth and production traits in two strains of japanese quails. Tamil. J.Vet.Anim.Sci. 6(5):223-230. [GoogleScholar]
Jatoi AS, Sahota AW, Akram M, Javed K, Jaspal MH, Hussain J, Mirani AH, Mehmood S (2013). Effect of different body weight categories on the productive performance of four close-bred flocks of Japanese quails (Coturnix coturnix japonica). J Anim Plant Sci. 23(1):7-13. [Google Scholar]
Oke UK, Herbert U, Nwachukwu EN (2004). Association between body weight and some egg production traits in the guinea fowl (Numida meleagris galeata. Pallas). Livest. Res.Rural Dev. 16(9):6. [Google Scholar]
Oana H (1951). The histories of native Japanese chickens. Nihonkei-Kenkyusha. Tokyo,3. [Google Scholar]
Goldstein DB, Pollock DD (1997). Launching microsatellites: a review of mutation processes and methods of phylogenetic inference. J.Hered. 88(5):335-342. [Google Scholar]
Petit E, Aulagnler S, Vaiman D, Bouissou C, Crouau-Roy B (1997). Microsatellite variation in an introduced mouflon population. J.Hered. 88(6):517-520. [Crossref] [GoogleScholar] [PubMed]
Queller DC, Strassmann JE, Hughes CR (1993). Microsatellites and kinship. Trends Ecol.Evol. 8(8):285-328. [Crossref] [Google Scholar]
Emara MG, Kim H, Zhu J, Lapierre RR, Lakshmanan N, Lillehojt HS (2002). Genetic diversity at the major histocompatibility complex (B) and microsatellite loci in three commercial broiler pure lines. Poult.Sci. 81(11):1609-1617. [Crossref] [Google Scholar] [PubMed]
Pandey AK, Tantia MS, Kumar D, Mishra B, Chaudhary P, Vijh RK (2002). Microsatellite analysis of three poultry breeds of India. Asian-australas. J. Anim. Sci. 15(11):1536-1542. [Google Scholar]
Zhang X, Leung FC, Chan DK, Chen Y, Wu C (2002). Comparative analysis of allozyme, random amplified polymorphic DNA, and microsatellite polymorphism on Chinese native chickens. Poult. Sci. 81(8):1093-1098. [Crossref] [Google Scholar] [PubMed]
Zhang X, Leung FC, Chan DK, Yang G, Wu C (2002). Genetic diversity of Chinese native chicken breeds based on protein polymorphism, randomly amplified polymorphic DNA, and microsatellite polymorphism. Poult. Sci. 81(10):1463-1472. [Crossref] [Google Scholar] [PubMed]
Osman SA, Sekino M, Nishibori M, Kawamoto Y, Kinoshita K, Yamamoto Y, Tsudzuki M (2004). Genetic variability and relationships of Japanese native chickens assessed by means of microsatellite profiling approach-Focusing on the Oh-Shamo (Japanese Large Game) and its related breeds. J Poult Sci.41(2):94-109. [Crossref] [Google Scholar]
Osman SM, Sekino M, Nishibori M, Yamamoto Y, Tsudzuki M (2005). Genetic variability and relationships of native Japanese chickens assessed by microsatellite DNA profiling-Focusing on the breeds established in Kochi Prefecture, Japan. Asian-australas. J. Anim. Sci. 18(6):755-761. [Crossref] [Google Scholar]
Osman SA, Sekino M, Kuwayama T, Kinoshita K, Nishibori M, Yamamoto Y, Tsudzuki M (2006). Genetic variability and relationships of native Japanese chickens based on microsatellite DNA polymorphisms-focusing on the natural monuments of Japan. J Poult Sci. 43(1):12-22. [Crossref] [Google Scholar]
Tuiskula-Haavisto M, Honkatukia M, Vilkki J, de Koning DJ, Schulman NF, Maki-Tanila A (2002). Mapping of quantitative trait loci affecting quality and production traits in egg layers. Poult. Sci. 81(7):919-927. [Crossref] [Google Scholar]
McElroy JP, Kim JJ, Harry DE, Brown SR, Dekkers JC, Lamont SJ (2006). Identification of trait loci affecting white meat percentage and other growth and carcass traits in commercial broiler chickens. Poult. Sci. 85(4):593-605. [Crossref] [Google Scholar] [PubMed]
Ya-Bo Y, Jin-Yu W, Mekki DM, Qing-Ping T, Hui-Fang L, Rong G, Qing-Lian G, Wen-Qi Z, Kuan-Wei C (2006). Evaluation of genetic diversity and genetic distance between twelve Chinese indigenous chicken breeds based on microsatellite markers. Int. J. Poult. Sci.5(6):550-556. [Google Scholar]
Kayang BB, Inoue-Murayama M, Hoshi T, Matsuo K, Takahashi H, Minezawa M, Mizutani M, Ito SI (2002). Microsatellite loci in Japanese quail and cross-species amplification in chicken and guinea fowl. Genet. Sel. Evol. 34(2):233-253. [Crossref] [Google Scholar] [PubMed]
Kayang BB, Vignal A, Inoue‐Murayama M, Miwa M, Monvoisin JL, Ito S, Minvielle F (2004). A first‐generation microsatellite linkage map of the Japanese quail. Anim. Genet. 35(3):195-200. [Crossref] [Google Scholar] [PubMed]
Groenen MA, Cheng HH, Bumstead N, Benkel BF, Briles WE, Burke T, Burt DW, Crittenden LB, Dodgson J, Hillel J, Lamont S (2000). A consensus linkage map of the chicken genome. Genome Res. 10(1):137-147. [Google Scholar] [PubMed]
Yonash N, Cheng HH, Hillel J, Heller DE, Cahaner A (2001). DNA microsatellites linked to quantitative trait loci affecting antibody response and survival rate in meat-type chickens. Poult. Sci. 80(1):22-28. [Crossref] [Google Scholar] [PubMed]
Hardiman W (2010). Nutrigenomics–implications for genetic companies. In Alltech technical symposium, Rogers, AR, 1-9. [Google Scholar]
Gholizadeh M, Mianji GR (2007). Use of microsatellite markers in poultry research. Poult. Sci. 6(2):145-153. [Google Scholar]
Miwa M, Inoue‐Murayama M, Kayang BB, Vignal A, Minvielle F, Monvoisin JL, Takahashi H, Ito S (2005). Mapping of plumage colour and blood protein loci on the microsatellite linkage map of the Japanese quail. Anim. Genet. 36(5):396-400. [Crossref] [Google Scholar] [PubMed]
Amirinia C (2007). Evaluation of Eight Microsatellite Loci Polymorphism in Four Japanese Quail (Coturnix japonica) Strain in Iran* C. Amirinia," H. Emrani," MA Radjaee Arbabe," R. Vaez Torshizi and" A. Nejati Javaremi". Pak. J. Biol. Sci. 10(8):1195-1199. [Google Scholar] [PubMed]
Bai JY, Pang YZ, Wu SJ, Yu MQ, Zhang XH, Zhao SJ, Xu HW (2013). Polymorphism Analysis of Chinese yellow quail using microsatellite markers. J Anim Plant Sci. 23(4):1072-1076. [Google Scholar]
Chang GB, Chang H, Liu XP, Zhao WM, Ji DJ, Mao YJ, Song GM, Shi XK (2007). Genetic diversity of wild quail in China ascertained with microsatellite DNA markers. Asian-Australasian J. Anim. Sci. 20(12):1783-1790. [Crossref] [Google Scholar] [PubMed]
Farrag, S.A.; Tanatarov, A.B.; Soltan, M.E.; Ismail, M.; Zayed, O.M (2011). Microsatellite analysis of genetic diversity in three populations of Japanese quail (Coturnix coturnix japonica) from Kazakhstan. J Anim Vet Adv. 10(18), 2376-2383. [Google Scholar]
Emrani H, Amirinia C, Arbabe MA (2011). Genetic variation and bottleneck in Japanese quail (Coturnix japonica) strains using twelve microsatellite markers. Afr. J. Biotechnol. 10(20):4289-4295. [Google Scholar]
Kim SH, Cheng KM, Ritland C, Ritland K, Silversides FG (2007). Inbreeding in Japanese quail estimated by pedigree and microsatellite analyses. Journal of heredity. 98(4):378-381. [Crossref] [Google Scholar] [PubMed]
Chazara O, Minvielle F, Roux D, Bed’hom B, Feve K, Coville JL, Kayang BB, Lumineau S, Vignal A, Boutin JM, Rognon X (2010). Evidence for introgressive hybridization of wild common quail (Coturnix coturnix) by domesticated Japanese quail (Coturnix japonica) in France. Conserv. Genet. 11(3):1051-1062. [Google Scholar]
Mukesh T, Rai ID, Mandhan RP, Sathyakumar S (2011). A panel of polymorphic microsatellite markers in Himalayan monal Lophophorus impejanus developed by cross-species amplification and their applicability in other Galliformes. Eur. J. Wildl. Res. 57(4):983-989. [Crossref] [Google Scholar]
Rashid MA, Manjula P, Faruque S, Bhuiyan AF, Seo D, Alam J, Lee JH, Bhuiyan MS (2020). Genetic diversity and population structure of indigenous chicken of Bangladesh using microsatellite markers. Asian-australas. J.Anim.Sci. 33(11):1732–1740. [Crossref] [Google Scholar] [PubMed]
Fathi M, El-Zarei M, Al-Homidan I, Abou-Emera O (2018). Genetic diversity of Saudi native chicken breeds segregating for naked neck and frizzle genes using microsatellite markers. Asian-Asian-australas. J.Anim. 31(12):1871. [Crossref] [Google Scholar] [PubMed]
Roh HJ, Kim SC, Cho CY,Lee J,Jeon D, Kim DK,Kim KW, Afrin F, KoY.G,Lee JH, Batsaikhan S, Susanti T,Hegay S,Kongvongxay S, Gorkhali NA,Thi LAN, ThaoTTT, Manikku L (2020).Estimating genetic diversity and population structure of 22 chicken breeds in Asia using microsatellite markers. Asian-Australas. J. Anim. Sci. 33(12):1896–1904. [Google Scholar] [PubMed]
Marks HL (1971). Selection for four-week body weight in Japanese quail under two nutritional environments. Poult. Sci. 50(3):931-937. [Crossref] [Google Scholar] [PubMed]
Brody S, Lardy A (1946). Bioenergetics and growth. The Journal of Physical Chemistry. 50(2): 168-169. [Crossref] [Google Scholar]
Papa CM (1991). Lower gut contents of broiler chickens withdrawn from feed and held in cages. Poult. Sci. 70(2):375-380. [Crossref] [Google Scholar]
Sams A.R, Alvarado C, Owens CM, (Eds.) (2001). Poultry meat processing. Boca Raton, FL: CRC Press. 7. [Google Scholar]
XLSTAT (2014). Statistical software for MS Excel. statiscal and data analysis with MS Excel Addinsoft 224 Centre Street, 3rd floor New York, Ny10013 USA.
Duncan DB (1955). Multiple range and multiple F tests. Biometrics. 11(1):1-42. [Google Scholar]
SAS (2008). Statistical analysis systems user’s guide,” Version 9.2. SAS Inst., Inc., Cary, NC. USA. pp: 17.
Nei M (1978). Estimation of average heterozygosity and genetic distance from a small number of individuals. Genetics. 89(3):583-590. [Crossref] [Google Scholar] [PubMed]
Glaubitz JC (2004). Convert: a user‐friendly program to reformat diploid genotypic data for commonly used population genetic software packages. Mol.Ecol.Notes. 4(2):309-310. [Crossref] [Google Scholar]
Yeh FC, Yang RC, Boyle T, Ye Z, Xiyan J M (1999). POPGENE 32-version 1.31. Population genetics software.
Botstein D, White RL, Skolnick M, Davis RW (1980). Construction of a genetic linkage map in man using restriction fragment length polymorphisms. Am. J.Hum.Genet. 32(3):314-331. [Google Scholar] [PubMed]
Kalinowski ST, Taper ML, Marshall TC (2007). Revising how the computer program CERVUS accommodates genotyping error increases success in paternity assignment. Mol.Ecol. 16(5):1099-1106. [Crossref] [Google Scholar] [PubMed]
Ugbo YS (2010). An assessment of biodiversity in morphological traits of Muscovy ducks in Nigeria using discriminant analysis. InProceedings of International Conference on Biology, Environment and Chemistry (ICBEC 2010). [Google Scholar]
Bai JY, Pang YZ, Zhang XH, Yun YX, Qi YX (2016). Microsatellite analysis of genetic diversity in quail populations from China. Rev.Bras.Cienc. 18(3):519-524. [Google Scholar]
Hata A, Takenouchi A, Kinoshita K, Hirokawa M, Igawa T, Nunome M, Suzuki T, Tsudzuki M (2020). Geographic Origin and Genetic Characteristics of Japanese Indigenous Chickens Inferred from Mitochondrial D-Loop Region and Microsatellite DNA Markers. Anim. 10(11):2074. [Crossref] [Google Scholar] [PubMed]
Bai JY, Huang Y, Zhang XH, Yang YB, Pang YZ, Qi YX (2018). Polymorphism analysis of 3 quail groups by using microsatellite marker. Life Sci J. 15(2). [Google Scholar]
Parmar SN, Tolenkhomba TC, Thakur MS, Joshi CG, Rank DN, Solanki JV, Srivastava PN, Pillai PV (2007). Analysis of genetic relationship among three varieties of indigenous Kadaknath breed using 25 chicken microsatellite markers. 6(2). [Google Scholar]
Ramadan GS, Moghaieb RE, El-Ghamry AA, El-Komy EM, Nassar FS, Ghaly MM, Stino FK (2014). Microsatellite Markers Assisted Selection for High Body Weight in Local Broiler Breeders. Int. J. 2(8):901-910. [Google Scholar]
Ramadan GS, Moghaieb RE, El-Ghamry AA, El-Komy EM, Stino FK (2018). Microsatellite marker associated with body weight in local Egyptian broiler line Cairo B-2. Bioscience Research. 15(4):3188-3201.
Vanhala T, Tuiskula-Haavisto M, Elo K, Vilkki J, Maki-Tanila A (1998). Evaluation of genetic variability and genetic distances between eight chicken lines using microsatellite markers. Poult. Sci. 77(6):783-790. [Crossref] [Google Scholar] [PubMed]
Daquan MQ, Aijun Q (2007). Genetic Diversity Analysis of Korean Quail Using Microsatellite DNA Markers. Fujian. J. Anim. Husb. Vet. Med. 1. [Google Scholar]
Rahim A, Kumar S, Yadav R, Debnath J, Krishnan J (2017). Uporaba mikrosatelitskih biljega za utvrđivanje genetske varijabilnosti kod dugotrajno selekcioniranih linija crvenih rodajland kokoši. Vet. Arh. 87(4):511-522. [Crossref] [Google Scholar]
Delany ME (2003). 1 5 Genetic Diversity and Conservation of Poultry. Poultry genetics, breeding, and biotechnology. 18:257-283. [Google Scholar]
Okumu ON, Ngeranwa JJ, Binepal YS, Kahi AK, Bramwel WW, Ateya LO, Wekesa FC (2017). Genetic diversity of indigenous chickens from selected areas in Kenya using microsatellite markers. J Genet Eng Biotechnol. 15(2):489-495. [Crossref] [Google Scholar] [PubMed]
Uemoto Y, Sato S, Odawara S, Nokata H, Oyamada Y, Taguchi Y, Yanai S, Sasaki O, Takahashi H, Nirasawa K, Kobayashi E (2009). Genetic mapping of quantitative trait loci affecting growth and carcass traits in F2 intercross chickens. Poult.Sci. 88(3):477-482. [Crossref] [Google Scholar] [PubMed]
Avise J.C (2004). Molecular markers, natural history, and evolution, Sinauer. Inc., Sunderland, MA. [Google Scholar]